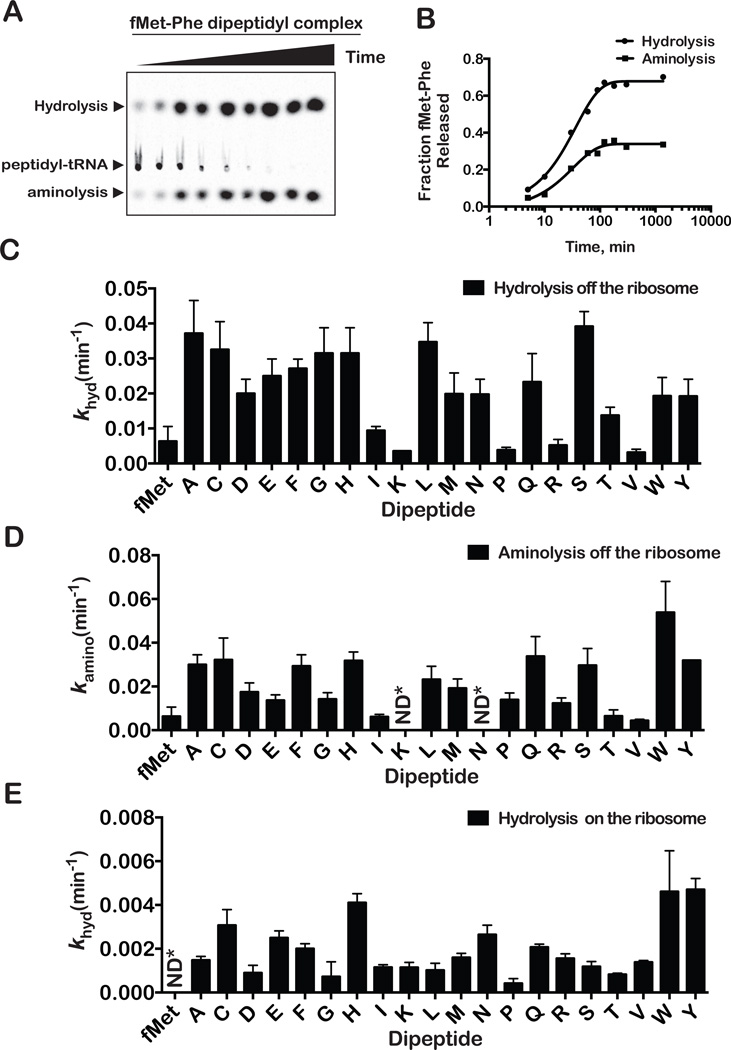
Figure 1. Nonenzymatic dipeptide hydrolysis and aminolysis.
(A) Representative electrophoretic TLC of a time course of nonenzymatic hydrolysis and aminolysis from free fMet-Phe peptidyl tRNA.
(B) Quantification of data in A. Fractional radioactivity corresponding to the released product was plotted against time and fit to one-phase exponential association equation.
(C) Dipeptide release rates calculated for hydrolysis of free peptidyl-tRNA.
(D) Dipeptide release rates calculated for aminolysis of free peptidyl-tRNA. Note the general similarity between hydrolysis and aminolysis rates.
(E) Dipeptide release rates calculated for nonenzymatic hydrolysis of ribosomal peptidyl-tRNA. The error bars represent the standard error obtained from the nonlinear regression. Most of the reactions were done in duplicates and the deviation was less than 20 % between the observed rates.

