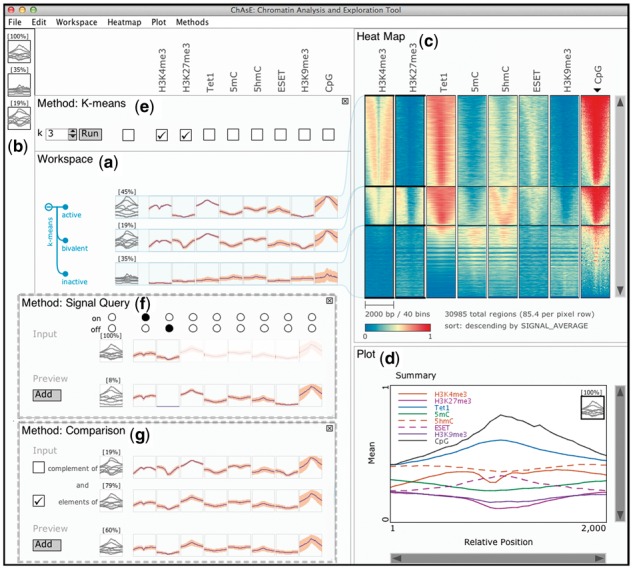
Fig. 1.

ChAsE Interface: (a) Workspace Pane, (b) Favourites Pane, (c) Heat Map Pane, (d) Plot Pane, (e) Method Pane with K-means currently active, alternatively (f) Method Pane with Signal Query Method, (g) Method Pane with Comparison Method. The heat map is sorted by average CpG as indicated by the black inverted triangle
