
Fig. 3.
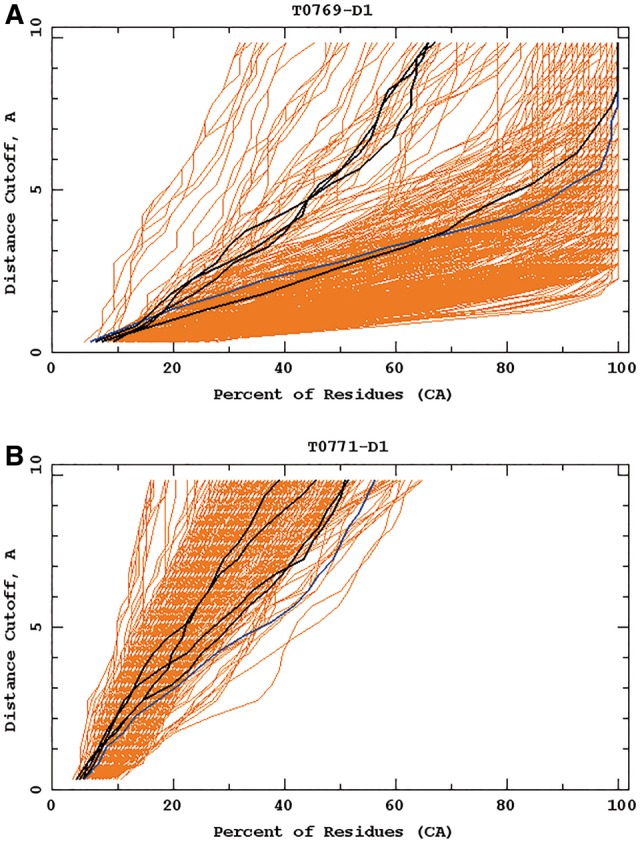
Example GDT-TS plots for targets T0769_D1 (A) and T0771_D1 (B). Cornell-Gdansk models are marked by dark lines and those corresponding to other groups' models are marked by brighter lines. The diagrams were taken from the official CASP11 website at http://www.predictioncenter.org/casp11 (Color version of this figure is available at Bioinformatics online.)