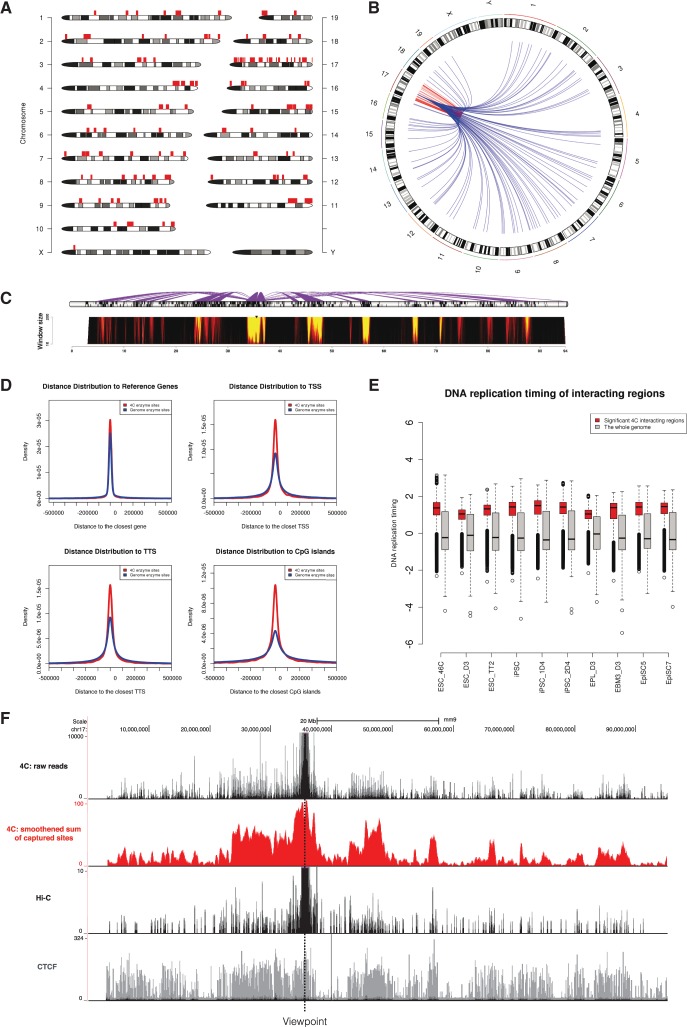
Fig. 1.
w4CSeq generated output for an enzyme digestion-based 4C-Seq dataset. (A) Genome wide‐distribution of 4C regions as indicated by red rectangles on top of chromosome ideogram. (B) Circos plot of genome‐wide distribution of 4C interactions as indicated by curves extended from the ‘bait’ region. Intra-chromosomal (cis) and inter-chromosomal (trans) interactions are shown in red and blue, respectively. (C) Spider plot (top) depicting contacts centered on the ‘bait’ region and domainogram (bottom) depicting interaction intensities across window size ranging from 2 to 200 restriction sites. (D) Density curve showing relative distance of 4C sites from key genomic features including reference genes, TSSs, TTSs and CpG islands compared to random. (E) Box plot showing the distribution of DNA replication timing values of 4C regions compared to the whole genome in 10 pluripotent cell lines. Early replication domains have the logarithm of replication timing ratio > 0. (F) 4C signals distributed in cis with the viewpoint. Upper black track shows the raw reads distribution with counts ranging from 0 to 10 000; Middle red track shows the running sum of captured sites in window (window size: 100 enzyme sites); Middle black track shows virtual‐4C profile extracted from Hi-C result; Lower grey track shows CTCF binding profile.

