
Figure 5. GCL function and Cysteine Levels in the Brain of Diabetic Mice.
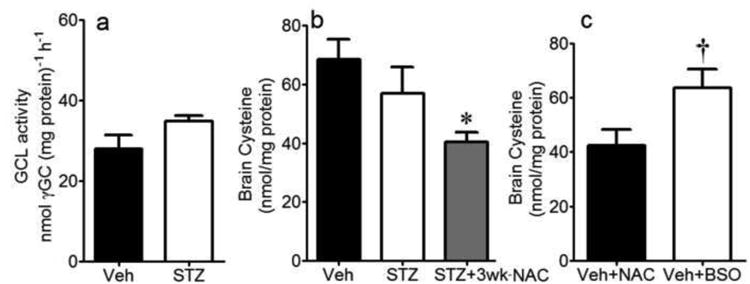
Brain GCL function, determined by γ -glutamylcysteine formation (a), and tissue cysteine levels (b) in Veh- or STZ-treated mice at 4wks diabetes. Cysteine levels were also measured in diabetic mice treated with NAC for 3wks (b), and in NAC-treated non-diabetic mice (n=7) or BSO (n=8) (c). *P<0.05 vs. Veh and STZ; †P<0.05 vs. Veh+NAC.