
Figure 7. Western blot analysis of MG-protein adducts, occludin and GCLc in the brain of diabetic mice.
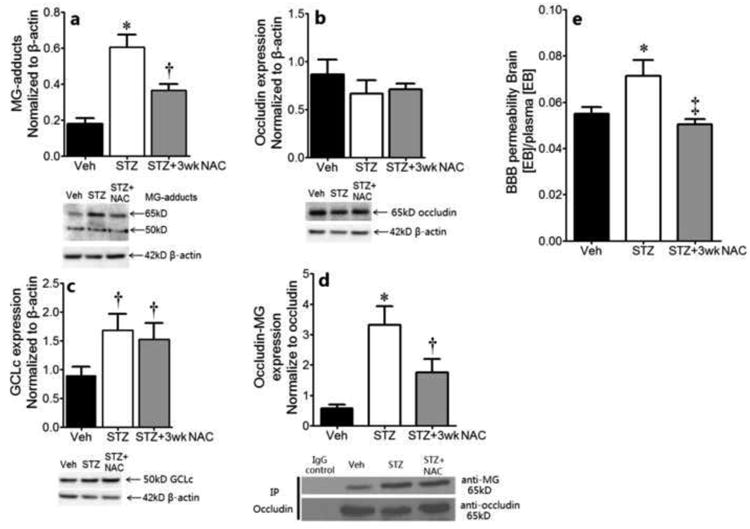
Expression of MG-protein adducts (a), occludin (b) and GCLc (c) in the brain of non-diabetic (Veh) and diabetic (STZ) mice, as measured by Western blot. Representative immunoblots are shown. The bar graphs show the quantitation of the protein band intensities normalized to β-actin; n=5/grp. (d): IP for occludin followed by immunoblot for MG, with quantification of the MG band intensity normalized to occludin. (e) The BBB permeability measured by Evans blue extrusion in control and diabetic mice-/+NAC, n=4/grp. *P<0.05 vs. Veh and STZ+3wk NAC; †P<0.05 vs. Veh; ‡P<0.05 vs. STZ.