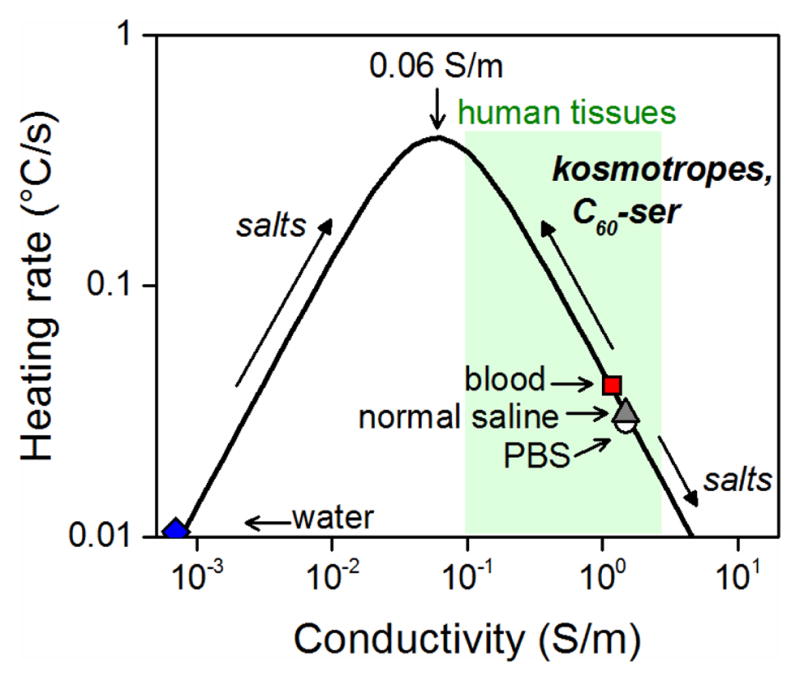
Figure 1.

The aqueous RF heating curve at 13.56 MHz. The peak heating conductivity and location of materials of interest on the curve are indicated and arrows indicate the shift resulting from addition of various materials. Note that maximum heating rate is dependent on the geometry20 of the material and the strength of the applied RF field.
