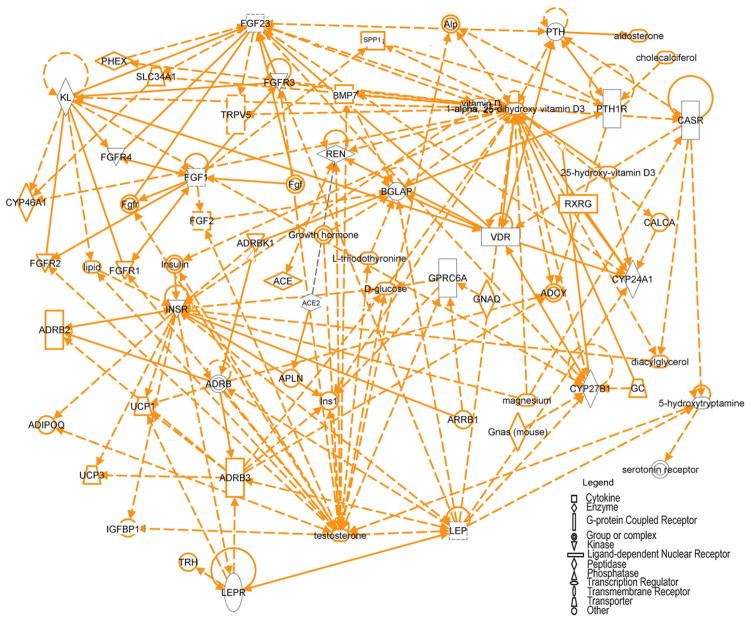
Figure 4.
Ingenuity pathway analysis of endocrine networks depicted in Figures 1 through 3. The Ingenuity Pathway Analysis systems identified multiple connections between these endocrine networks. Gene products are represented as nodes and biological relationships between two nodes are represented as a line. Continuous lines indicate direct interactions, and dashed lines represent indirect connections. Shapes of nodes symbolize functional classes of gene products. Notable genes identified in the network include ACE2, β-adrenergic receptor (ADRB), bone gamma-carboxylgutamic acid protein (BGLAP), Ocn, CASR, CYP24A1, CYP27B1, FGF23, FGFR, GPRC6A, insulin receptor (INSR), KL, leptin (LEP), leptin receptor (LEPR), PTH, PTH1R, renin (REN), vitamin D receptor (VDR), SPP1, TRPV5, uncoupling protein (UCP), phosphate regulating endopeptidase (Phex), alkaline phosphatase (Alp), glucocorticoid (GC).

