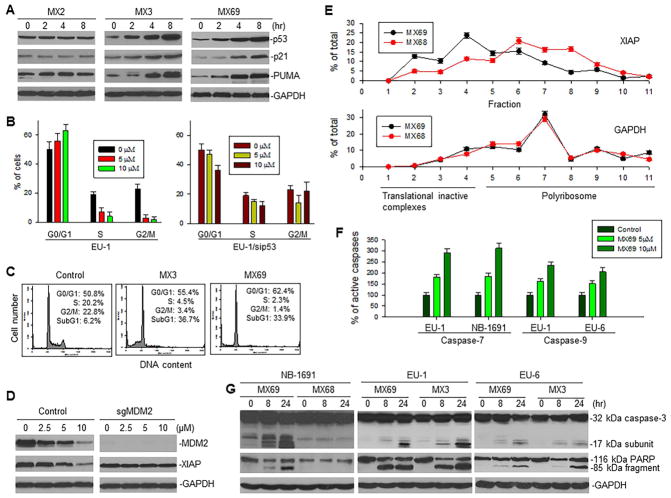
Figure 5.
Effect of leads on expression and function of p53 and XIAP following inhibition of MDM2 (A) Western blot for expression of p53 and its targets p21 and PUMA in EU-1 cells treated with 1 μM MX3 or 10 μM MX69 for indicated times. (B) Cell-cycle distribution of EU-1 and EU-1/sip53 cells treated with MX69 for 8 hr. (C) Representative flow cytometry histographs for EU-1 cells, both control and treated with 1 μM MX3 and 10 μM MX69. (D) Western blot for expression of MDM2 and XIAP in SH-EP1 cells with MDM2 KO by CRISPR/Cas9 (sgMDM2), treated with indicated doses of MX69 for 24 hr. (E) EU-1 cells were treated with either 10 μM MX69 or MX68 (control) for 4 hr and their cytoplasmic lysates were fractionated on a sucrose gradient. RNA was extracted from each of the fractions and subjected to qRT-PCR for analysis of the distribution of XIAP and GAPDH mRNAs. Data show the percentage of the total amount of corresponding mRNA in each fraction and represent mean ± SD of three independent experiments. (F) ELISA for activation of caspase-7 and -9 in ALL and NB cells treated with different doses of MX69 as indicated for 8 hr. (G) Western blot showing activation of caspase-3 and cleavage of death substrate PARP in cancer cells following treatment with 10 μM MX69 and MX68 (control) or 1 μM MX3 for times indicated. Data in (B and F) represent mean of three independent experiments, bars ± SD. See also Figure S5.

