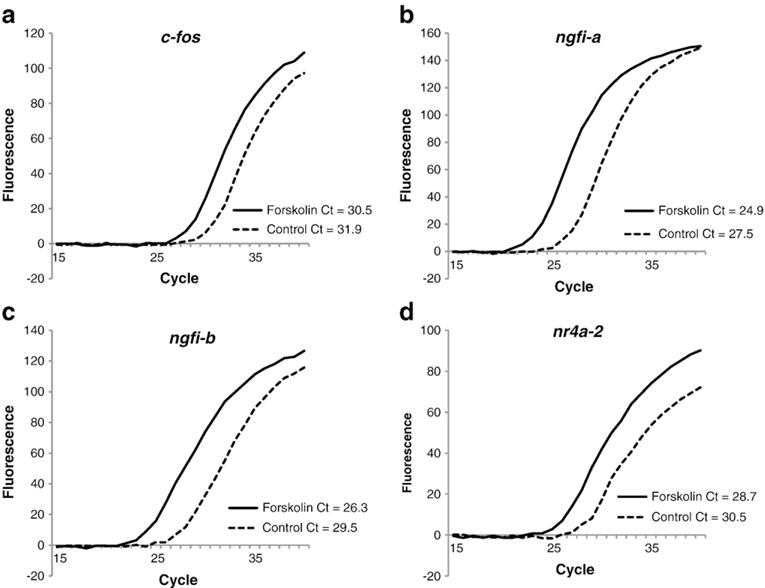
Fig. 3.

Validation of the quantitative RT-PCR assays of the immediate early genes: c-fos (a), ngfi-a (b), ngfi-b (c), nr4a-2 (d) after forskolin stimulation. The figure depicts fluorescent growth curves and cycle threshold values for each of these immediate-early genes in cultured rat neuroblastoma (B35) cells that were stimulated with forskolin (solid line) versus those that were not (dotted line). The Cfos, NGFIA, NGFIB, and NR4A2 primers are shown in Table 1. In each case, there was an increase (lower Ct value) in the IEG mRNA in the forskolin-stimulated cultures as compared with the mRNA in non-stimulated cultures.
