
Fig. 4.
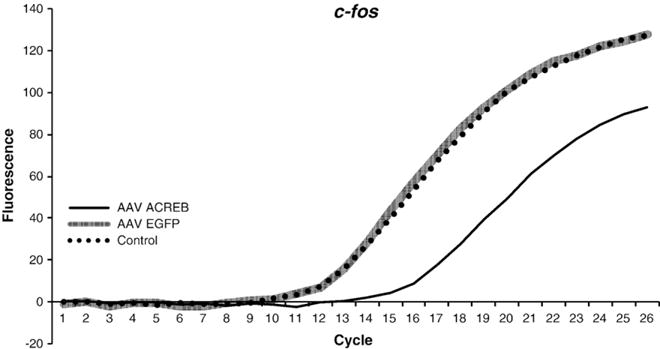
Efficacy of the A-CREB-T2A-EGFP construct to inhibit induced c-fos expression in vitro. The graph shows fluorescent growth curves and cycle threshold values for c-fos mRNA in HEK-293 t cells under control conditions and after stimulation with forskolin. Cells were either transduced with A-CREB-T2A-EGFP AAV, EGFP-AAV, or not transduced with any virus (control). Human c-fos primer was used in the qPCR assay (see Table 1). Note that there was a large reduction in c-fos mRNA (higher Ct value) in the cells that were transduced with A-CREB AAV relative to those that were transduced with the EGFP-only control AAV. The non-transduced control cells and those that were transduced with the EGFP-only AAV exhibited similar fluorescent growth curves.