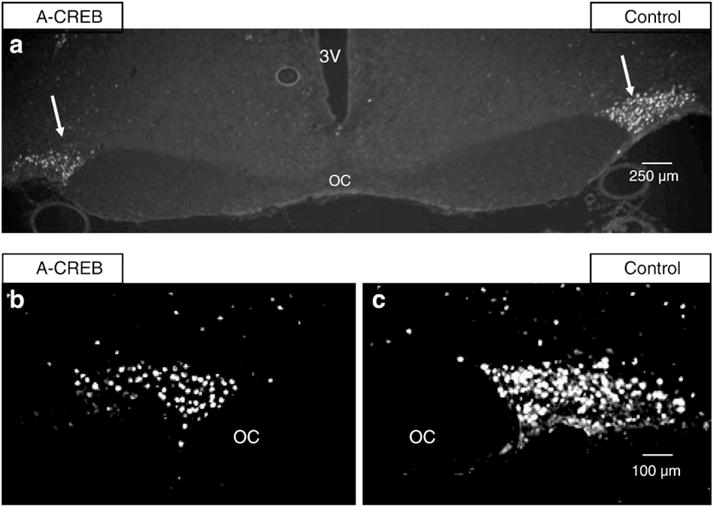
Fig. 5.

Immunohistochemical staining for c-Fos protein in the SONs of rats in which the left SON was injected with the AAV containing A-CREB and the right SON with a control AAV. (a) Fos immunoreactivity. Both left and right SONs (arrows) are demonstrated here at low power (4× magnification). Note that there is more c-Fos immunofluorescence in the control SON after an acute salt loading stimulus. The 3rd ventricle is labeled 3 V, the optic chiasm, OC. (b and c) Illustrate higher magnification views (10×) of Fos immunofluorescence in A-CREB AAV treated and control AAV SONs in a different rat. The SONs are outlined by white lines. (b) Shows Fos immunoreactivity in the A-CREB treated SON versus the contralateral control SON (c) after an acute salt loading stimulus. This image demonstrates, in an additional rat, that c-Fos immunoreactivity is reduced in the A-CREB treated SON relative to the contralateral, control SON. See Table 2 for related changes in mRNA for all the intermediate genes under these experimental conditions.
