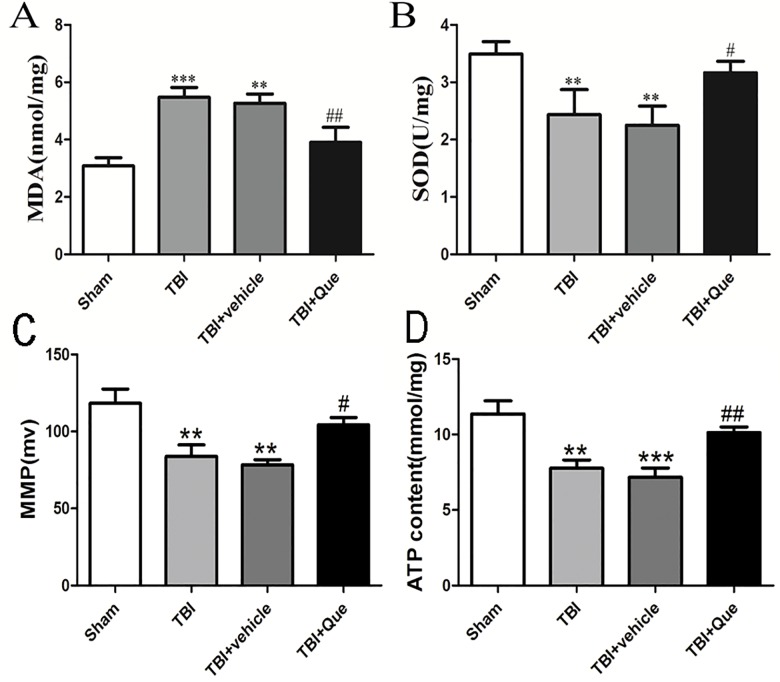
Fig 4. Que attenuated Mitochondrial oxidative stress and biogenesis caused by TBI.
(A) Measurements of MDA levels. (B) The activities of SOD. (C) MMP. (D) Intracellular ATP content. Data represent the mean ± SEM (n = 5 per group). **P<0.01 and ***P<0.001 compared with the sham group; #P<0.05 and ##P<0.01 compared with the TBI + vehicle group.

