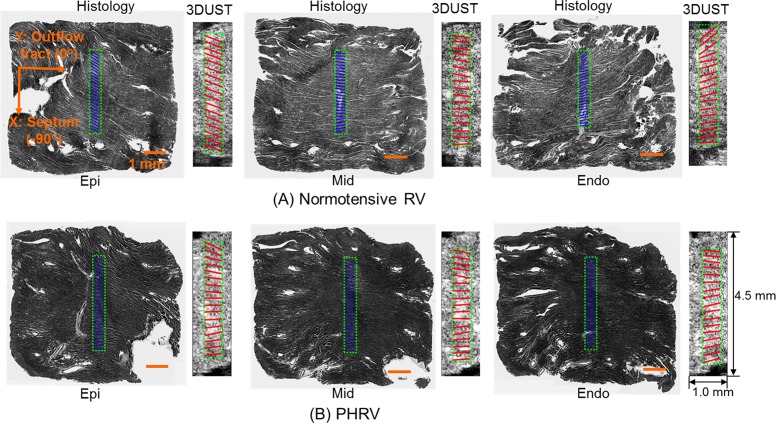
Fig 4.
Representative reconstructed fiber orientations of (A) normotensive and (B) PHRV samples. The fiber orientation angle was defined as Y: outflow tract (0°) and X: septum (-90°). The fiber orientations obtained by 3D-UST (red solid lines) overlaid with ultrasound images compared with histology-quantified fiber orientations (solid blue lines) overlaid with corresponding histological images at near the epi-cardium, middle myocardium and near the endo-cardium.

