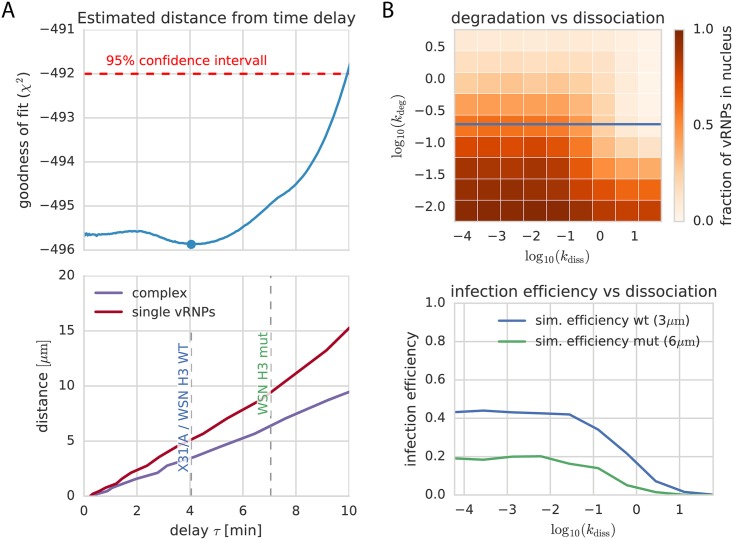
Fig 4. Combination of ODE and diffusion model.
(A, upper panel) The profile likelihood of the delay time between membrane fusion and vRNPs reaching the nucleus (τ) as resulting from our ODE model (see profile likelihood for kτ in S4 Fig) shows a minimum at 4 min. We can use this value to calculate a mean fusion distance using our 3D diffusion simulations (A, lower panel). We obtain an estimated distance of 5 μm for dissociated single vRNPs and 3 μm for the full complex. (B) Scanning the parameter space of the spatial model around the values suggested by the ODE fits shows a strong dependence of dissociation (kdiss = [10−4, 10−1]) and degradation (kdeg = [10−6, 1]) during diffusion. Both of which would lead to strongly inhibited infection efficiency. The blue line shows the experimentally identified degradation rate. To better compare the infection efficiency of both used virus strains, the lower panel shows simulations for different dissociation constants with the predicted distances for WSN H3 wt and mut. The estimated distance difference leads to a 50% lower infection efficiency in our simulations.

