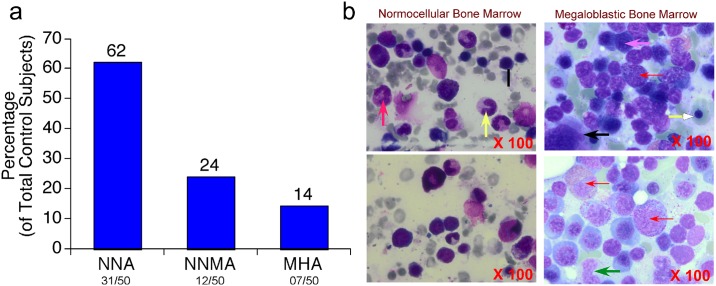
Fig 1. Distribution of control non-megaloblastic anemia participants & Analysis of bone marrow collected from non-megaloblastic anemia controls and megaloblastic anemia cases using Leishman’s staining.
(a) Analysis of non-megaloblastic anemia control subjects using bone marrow aspirate normocytic-normochromic anemia (62%, 31/50); normocytic-normochromic with microcytic hypochromic anemia (24%, 12/50) and microcytic hypochromic anemia (14%, 7/50) (b) Photomicrographs (at 100X magnification) of Leishman’s stained bone marrow samples collected from control non-megaloblastic anemia and cases with megaloblastic anemia. Bone marrow from control subjects showed normal cellularity with erythroid cells showing—normal maturation (Black arrow),—myeloid series cells and megakaryocytes along with mature neutrophils (Red arrow) and Band forms (Yellow arrow). Megaloblastic anemia cases showed erythroid hyperplastic cells (Pink arrow) and open chromatin (Red arrow). Cells with more cytoplasm (Yellow arrow), giant sized nuclei (metamyelocytes, Black arrow) and band forms (neutrophils, Green arrow) and nuclear hyper segmentation and abnormal maturation (megakaryocytes) were observed only in MBA cases but not in control subjects.

