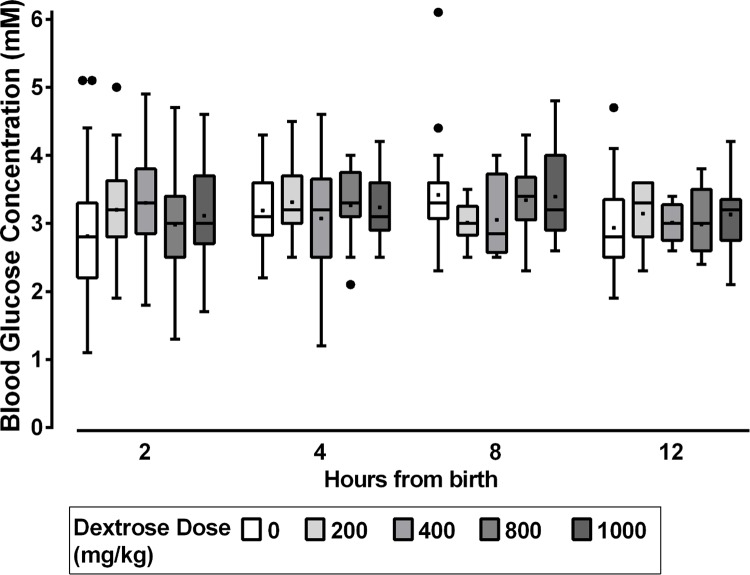
Fig 3. Median blood glucose concentration at four time intervals for each dose regime of dextrose gel.
Boxplots for blood glucose concentration (mM) at time = 2, 4, 8, and 12 h ± 30 min, for each cumulative dose of prophylactic dextrose gel, where 0 mg/kg is placebo, 200 mg/kg is 0.5 ml/kg dextrose once, 400 mg/kg is 1 ml/kg once, 800 mg/kg is 0.5 ml/kg for four doses, and 1,000 mg/kg is 1 ml/kg once followed by 0.5 ml/kg for a further three doses. The box represents 25th to 75th percentiles. The horizontal bar within the box is the median, and the solid dot within the box is the mean. The whiskers are 1.5 (interquartile range [IQR]) above and below the 25th and 75th percentile. Solid dots beyond the whiskers represent outliers.

