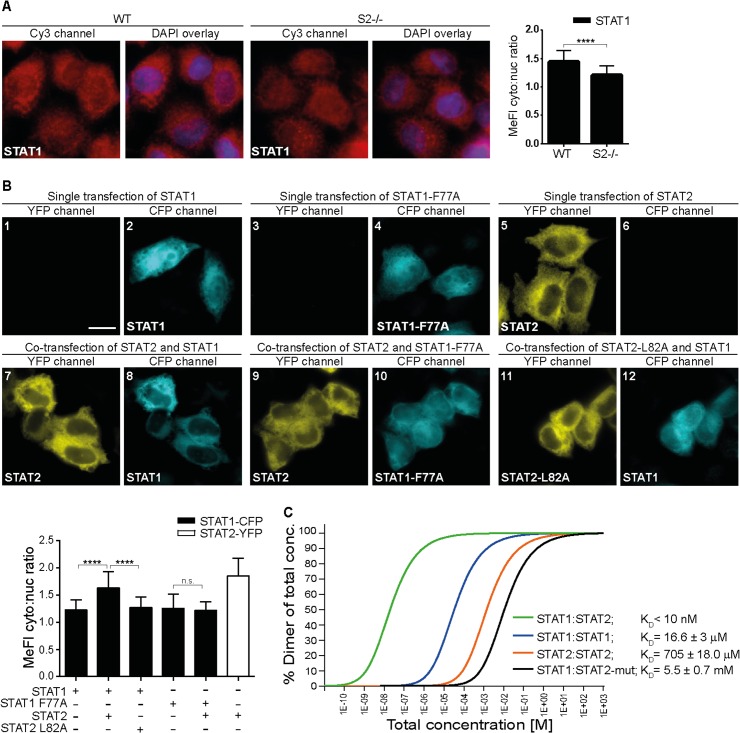
Fig 1. STAT2 binds STAT1 via high affinity N Domain interactions.
(A) Stat2-deficient human U6A cells (S2-/-) and parental 2fTGH cells (WT) were fixed and processed for immunostaining using STAT1 antibody, nuclear counterstaining was with DAPI. Shown are deconvolution fluorescence micrographs. The corresponding bar graphs show STAT1 cytoplasmic/nuclear signal ratios and standard deviation (s.d.) produced using line scanning to acquire mean fluorescence intensities (MeFIs) in cytoplasm and nucleus. Scale bar = 15 μm. (B) STAT1-CFP and STAT2-YFP variants were singly or coexpressed in HeLa cells and their localization was determined by deconvolution fluorescence microscopy. Bar graphs show cytoplasmic/nuclear signal ratios for STAT1 (black bars) and STAT2 (white bar) acquired as described in (A). Scale bar = 15 μm. (C) Equilibration sedimentation analyses of homo- and heterotypic associations of STAT1 and STAT2 recombinant N domains. Equilibrium dissociation constant (KD); (STAT2-mut) STAT2 LL81,82AA. See S1 Data for raw data.

