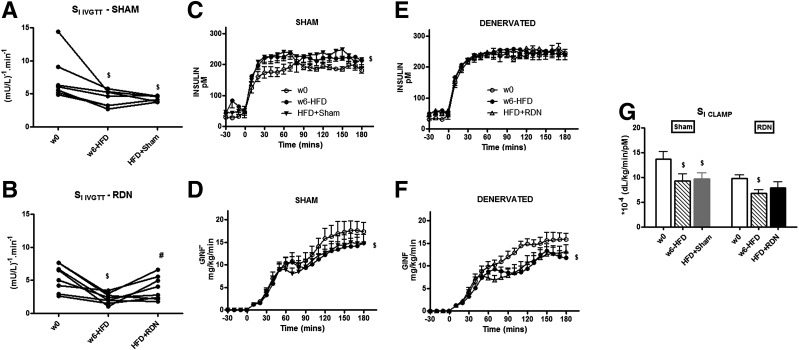
Figure 3.
Whole-body SI measured by minimal model and EGC. A and B: SI IVGTT as assessed by minimal model shows that RDN surgery reverses HFD-induced insulin resistance. C–G: Time course data of plasma insulin concentration (C and E), GINF rate (D and F), and SI clamp and whole-body SI (G) as assessed during the EGC show that RDN reverses insulin resistance to EGP. Sham n = 7 and RDN n = 8. $P < 0.05 vs. w0; #P < 0.05 vs. w6-HFD as measured by two-way ANOVA.

