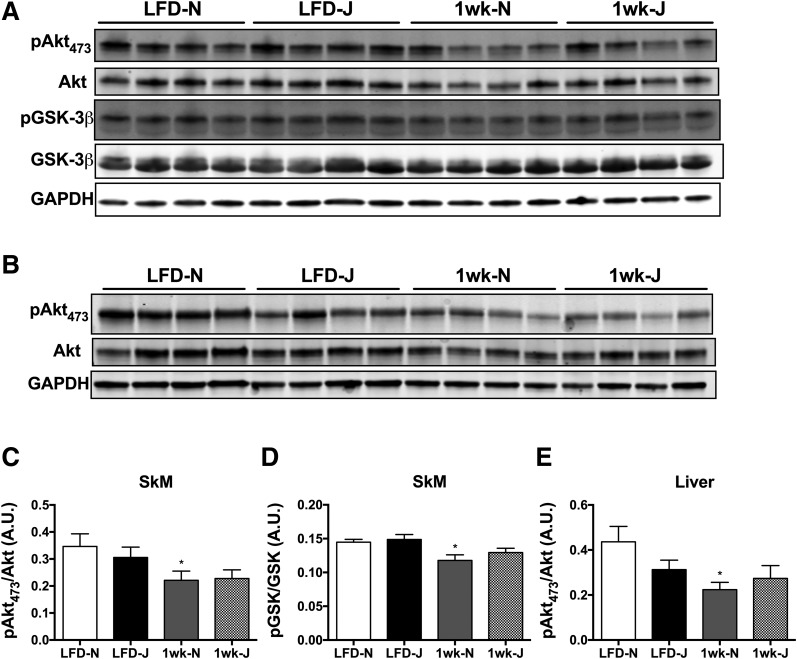
Figure 3.
Differences in insulin-stimulated Akt signaling in skeletal muscle and liver of 6J and 6N mice fed an HFD for 1 week. Representative blots from skeletal muscle (A) and liver (B) lysates probed for p-Akt (serine 473), total Akt, p-GSK-3β, total GSK-3β, and GAPDH. C–E: Quantitation of p-Akt and p-GSK-3β blots normalized to total Akt and GSK-3β, respectively. *Different from respective low-fat control group (P < 0.05). Data are mean ± SEM; N = 7 to 8/group. A.U., arbitrary units. SkM, skeletal muscle.

