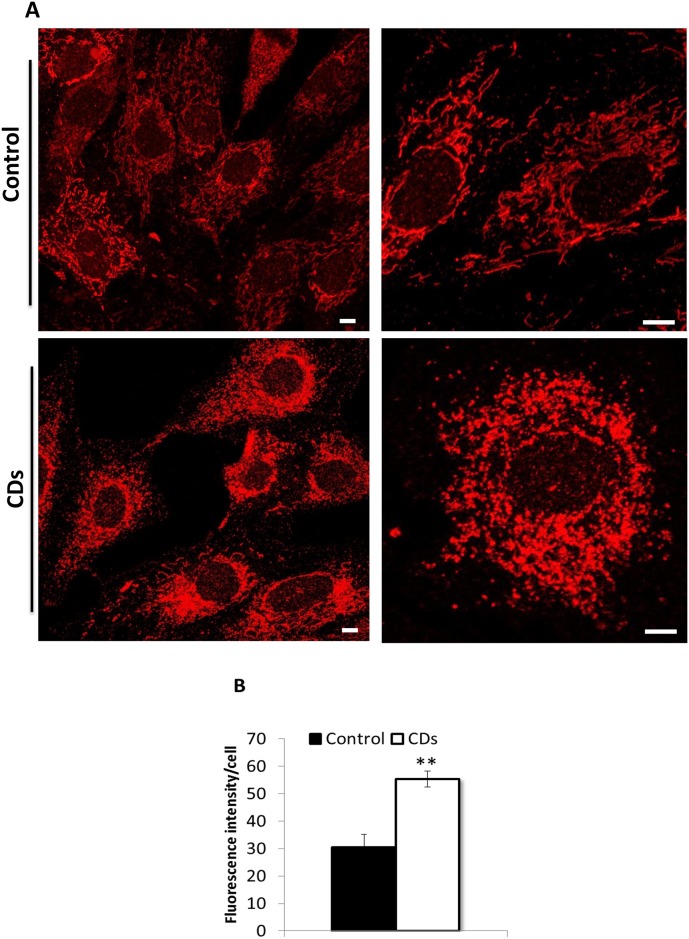
Fig 2. Mitochondrial morphology.
(A) Representative confocal microscopy images of control (upper panel) and CDs fibroblasts (lower panel) stained with MitoTracker Red. (B) Quantification of MitoTracker Red fluorescence intensities per cell volume (n = 200 cells). Values are mean ± S.E. of three independent experiments. Scale bar, 10 μm. **p<0.01.

