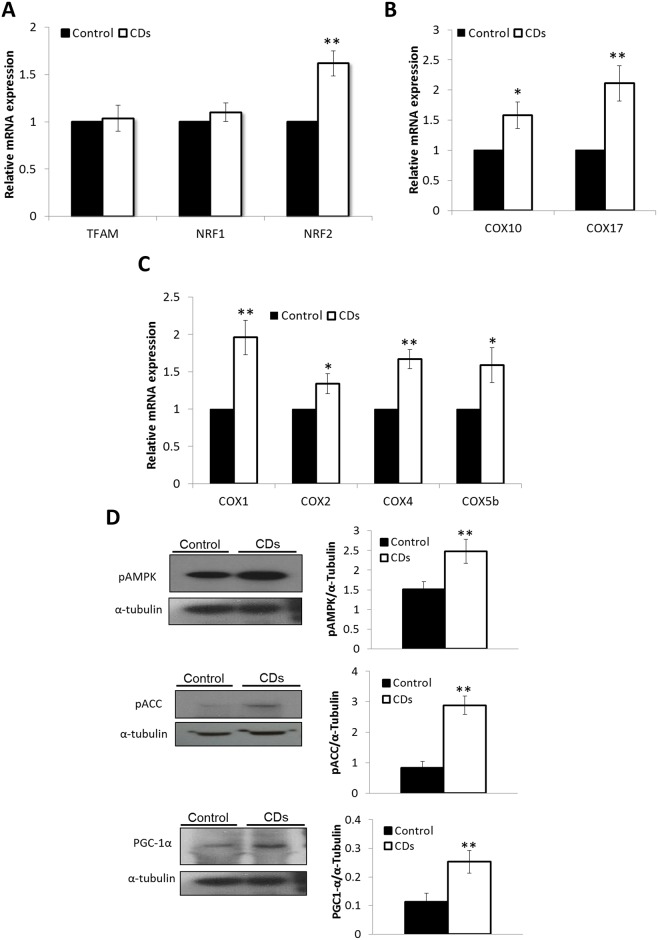
Fig 5. Mitochondrial biogenesis.
(A) Relative mRNA-expression of mitochondrial-biogenesis related genes. (B) Relative mRNA-expression of COX subunits. (C) Relative mRNA-expression of COX chaperones. (D) Western-blot analysis of pAMPK, pACC and PGC1-α. On the right panel, band intensity ratios relative to α-Tubulin are shown. Western blots images are representative of 3 independent experiments. Gene expression is shown as fold change of expression relative to control fibroblasts. Data are mean ± S.E. (n = 3). *p<0.05, **p<0.01.

