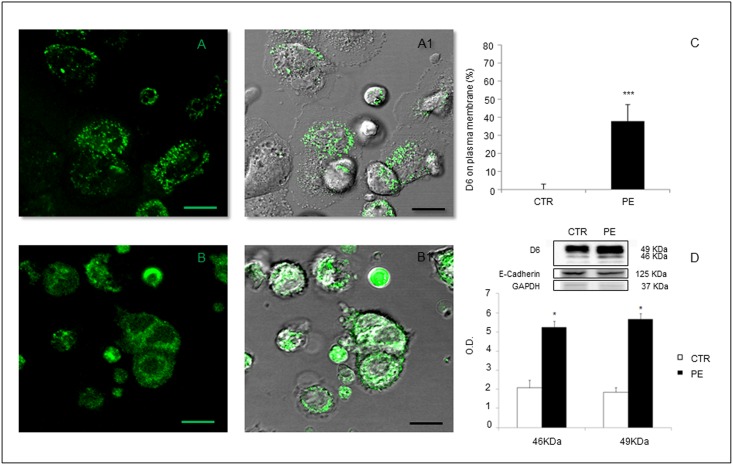
Fig 2. Representative image of D6 expression in primary trophoblast cell cultures from normal pregnant women (A and A1) or a women with PE (B and B1) assessed by confocal microscopy.
Cells from PE patients showed a more intense expression of D6 (green) on cell membranes together with a more diffuse cytoplasm distribution compared to control cells, which displayed atypical speckled cytoplasmic D6 positivity. A and B: D6 fluorescent staining. A1 and B1: D6 overlay between fluorescent staining and electronic transmission. Scale bar 20 μm. Quantification of D6 expression on trophoblast cell membranes was performed by (C) confocal analysis of fluorescence on membranes, as percentage of the whole cells fluorescence, and (D) Western blot analysis of D6 on cell membrane lysates. Expression of both 46 and 49 KDa isoforms of D6 was increased in trophoblast membranes in PE. Results are expressed as mean ± SE of six experiments.*p<0.05; ***p<0.001.

