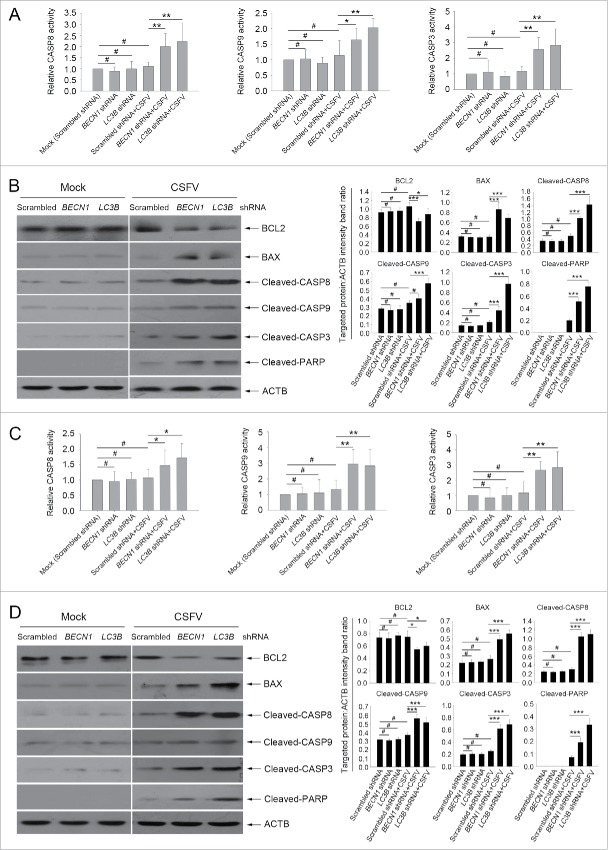
Figure 5.
Autophagy deficiency leads to the activation of apoptosis pathways in CSFV-infected cells. ((A)and C) PK-15 (A) and 3D4/2 (C) cells were transfected and infected as described in the legend to Fig. 2A and C. At 48 h after infection, the activity of CASP3, CASP8, and CASP9 in cells was measured by the CASP activity assay as described in Materials and Methods. The data represent the mean ± SD of 3 independent experiments. One-way ANOVA test; test of homogeneity of variances, P > 0.05, LSD (L) was used for correction of post-hoc test. *, P < 0.05; **, P < 0.01; #, P > 0.05. ((B)and D) PK-15 (B) and 3D4/2 (D) cells were transfected and infected as described in the legend to Fig. 2A and C. After 48 h, the expression of BCL2, BAX, cleaved-CASP3, cleaved-CASP8, cleaved-CASP9, cleaved-PARP, and ACTB (loading control) were analyzed by western blot with specific antibodies as described in Materials and Methods. The relative expression ratios of these proteins were analyzed by densitometric scanning. The data represent the mean ± SD of 3 independent experiments. One-way ANOVA test; test of homogeneity of variances, P > 0.05, LSD (L) was used for correction of post-hoc test. *, P < 0.05; ***, P < 0.001; #, P > 0.05.

