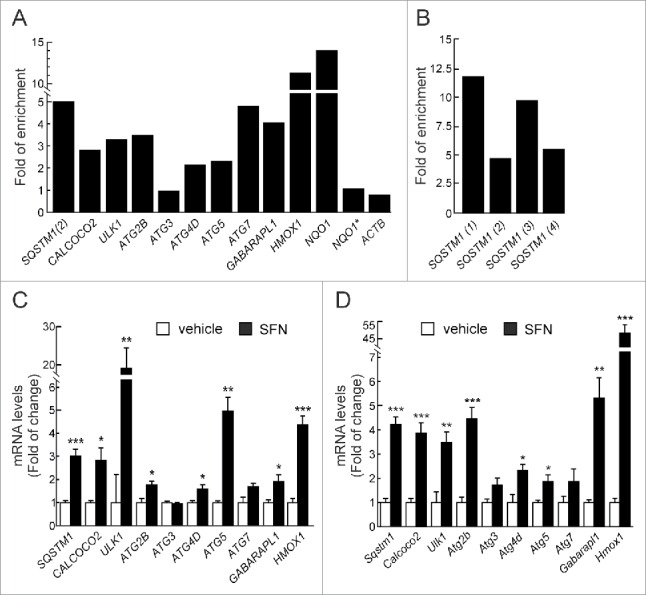
Figure 1.

NFE2L2 modulates autophagy gene expression. (A) HEK293T cells were transfected with an expression vector for NFE2L2ΔETGE-V5.27 ChIP analysis was performed with anti-IgG or anti-V5 antibodies and the potential AREs with the highest score were analyzed by qRT-PCR. (B) The same ChIP analysis of putative AREs in the promoter of SQSTM1. The figures show representative data normalized as the fold of enrichment with the anti-V5 antibody vs. the IgG antibody. In (A), ACTB and an upstream region of NQO1 that does not contain any ARE (NQO1*) were analyzed as negative controls. Previously described AREs in HMOX1, NQO1, SQSTM1 and CALCOCO2 were analyzed as positive controls. These experiments were repeated 3 times with similar results. In (B), numbers in brackets indicate the AREs from Table 1 specifically amplified. (C and D) HEK293T and HT22 cells were submitted to sulforaphane (SFN, 15 μM) for 12 h. mRNA levels of the indicated genes were determined by qRT-PCR and normalized by Actb levels. Data are mean ± SEM (n = 3). Statistical analysis was performed with the Student t test. *, p < 0.05; **, p < 0.01; and ***, p < 0.001 vs. untreated conditions.
