
Figure 2.
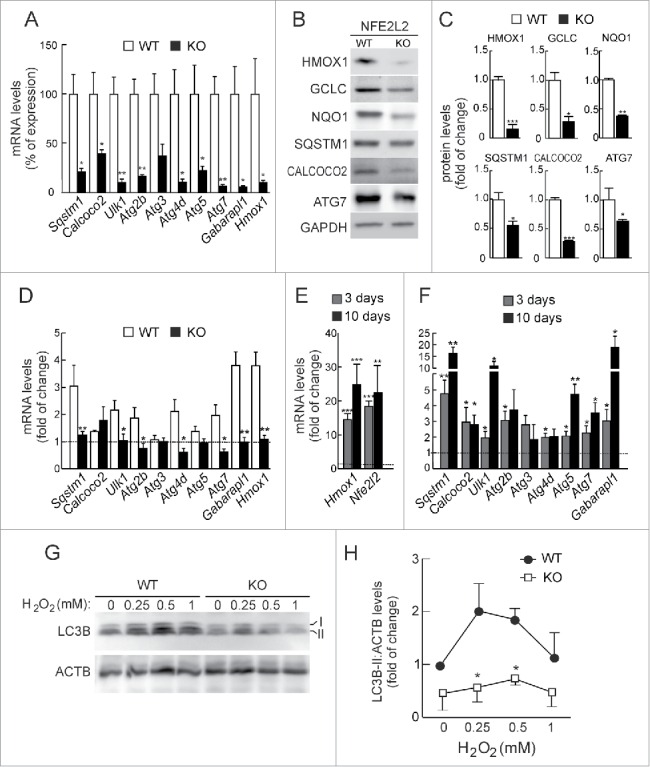
NFE2L2 deficiency results in decreased autophagy gene expression. (A) Expression levels of the indicated genes from Nfe2l2-WT and nfe2l2-KO mouse embryonic fibroblasts (MEFs) were determined by qRT-PCR and normalized by Actb levels. Data are mean ± SEM (n = 3). Statistical analysis was performed with the Student t test. *, p < 0.05; **, p < 0.01; and ***, p < 0.001 vs. Nfe2l2-WT MEFs. (B) Representative immunoblots for the indicated proteins of Nfe2l2-WT and nfe2l2-KO MEFs. (C) Densitometric quantification of representative blots from (B) relative to GAPDH levels. Data are mean ± SEM (n = 3). Statistical analysis was performed using the Student t test. *, p < 0.05; **, p < 0.01; and ***, p < 0.001 vs. Nfe2l2-WT MEFs. (D) Nfe2l2-WT and nfe2l2-KO MEFs were submitted to SFN (15 µM, 6 h). mRNA levels of the indicated genes were determined by qRT-PCR and normalized to Actb levels. (E) nfe2l2-KO MEFs were transduced with NFE2L2ΔETGE-V5 or GFP-expressing lentivirus and mRNA levels of the indicated genes were analyzed by qRT-PCR following 3 and 10 after transduction. For (D) and (E), bars represent the fold of change normalized to the untreated condition (D), or GFP-lentivirus infection (E) depicted with the dashed lines. Data are mean ± SEM (n = 3). Statistical analysis was performed with the Student t test. *, p < 0.05; and **, p < 0.01 vs. control conditions. (F) Nfe2l2-WT and nfe2l2-KO cells were treated with the indicated concentrations of H2O2 during 6 h. Representative immunoblots for the indicated proteins of Nfe2l2-WT and nfe2l2-KO MEFs. (G) Densitometric quantification of representative blots from (F) relative to ACTB/β-actin levels. Data are mean ± SEM (n = 3). Statistical analysis was performed using Student t test. *, p < 0.05 vs. Nfe2l2-WT.