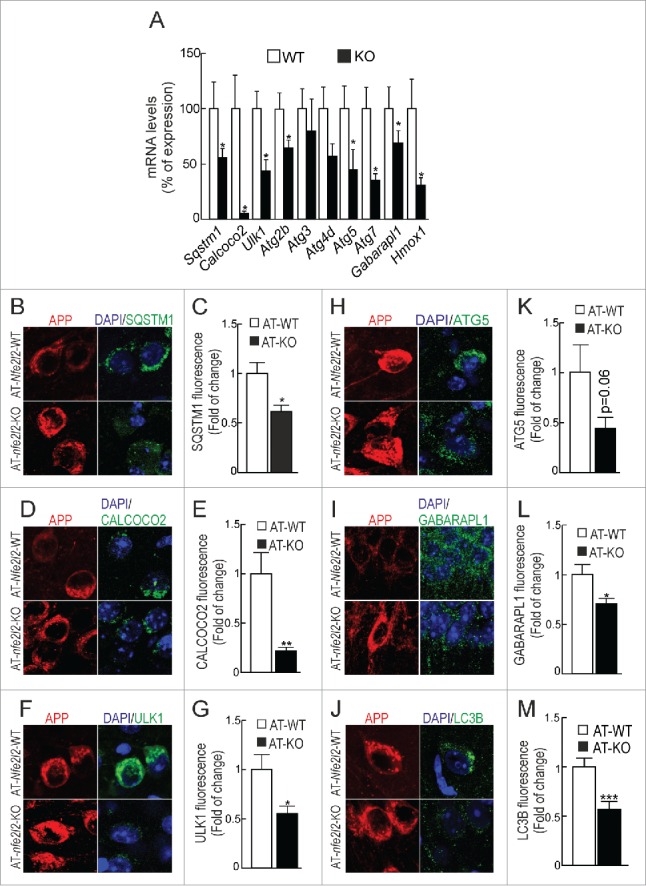
Figure 3.

NFE2L2 deficiency impairs autophagy in neurons. (A) Expression levels of the indicated genes from Nfe2l2-WT and nfe2l2-KO primary hippocampal/cortical neurons were determined by qRT-PCR and normalized to Actb levels. Data are mean ± SEM (n = 3). Statistical analysis was performed with the Student t test. *, p <0.05 vs. Nfe2l2-WT neurons. (B-G) Confocal analysis of double immunofluorescence with anti-APP/Aβ (4G8, red) and anti-SQSTM1, CALCOCO2, ULK1, ATG5, GABARAPL1 or LC3B (green) antibodies in brain of AT-Nfe2l2-WT and AT-nfe2l2-KO. Fluorescence intensity was analyzed in the cytosol of 100 randomly chosen APP-positive neurons of each genotype. Quantification was derived from 3 independent experiments with 2 fields per experiment. Fluorescence intensity was quantified in 1.5-µm-thick stacks using ImageJ software. Data are mean ± SEM. Statistical analysis was performed with a Student t test. *, p < 0.05; **, p < 0.01; and ***, p < 0.001 vs. AT-Nfe2l2-WT mice.
