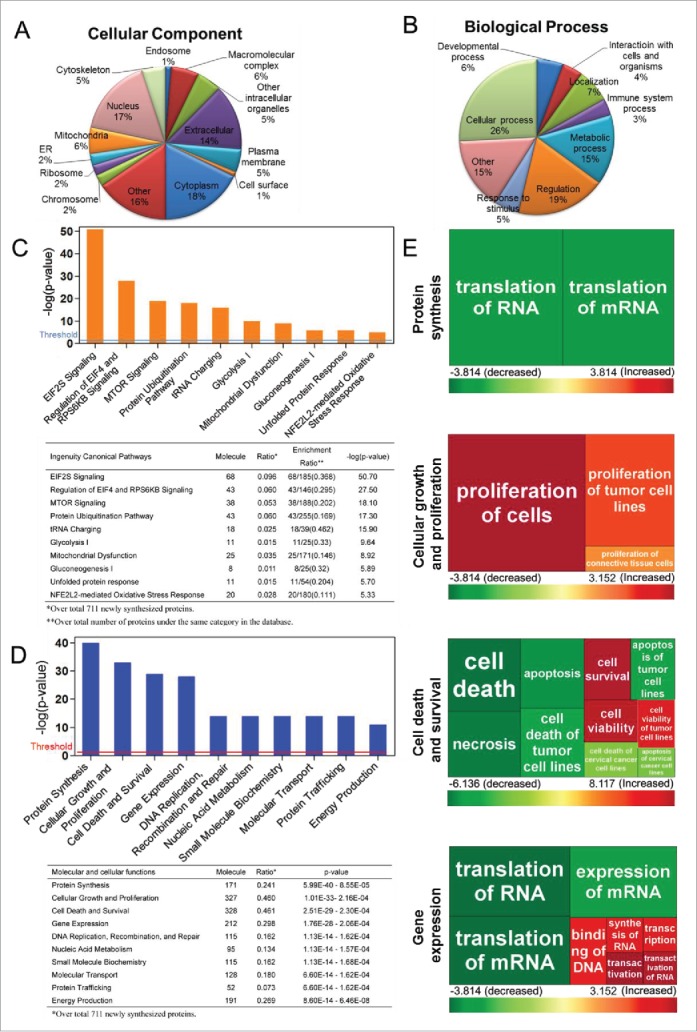
Figure 3.

Gene Ontology (GO) analysis, canonical pathways, molecular and cellular functional analysis of de novo protein synthesis during autophagy. GO terms for cellular component (A) and biological process (B) of the de novo proteins analyzed based on the Software Tool for Rapid Annotation of Proteins. Proteins may be classified into multiple categories; percentages are computed as fraction of total assignments. Ingenuity Pathway Analysis (IPA) software reveals the top canonical pathways (C) and the molecular and cellular functions (D) with which the de novo proteins are associated. The ranking was based on the p values derived from the Fisher's exact test. The high-ranking categories are displayed along the x axis in a decreased order of significance. The y axis displays the -log(p-value). The horizontal line denotes the cutoff threshold for significance (p < 0.05). The statistical data of IPA analysis are shown below the bar chart. (E) Heat maps showing the top 4 molecular and cellular functions as listed in (D), to which the newly synthesized proteins may be involved: protein synthesis, cellular growth and proliferation, cell death and survival, and gene expression. Each square represents a subcategory under the individual function indicated to the left. The size of the square is proportional to -log (p-value) of the subcategory, derived from the Fisher's exact test. The color of the square corresponds to the activation z-score of the subcategory. Colors red and green indicate predicted activation and inhibition levels of individual subcategories, respectively (Tables S2–S5).
