Figure 4.
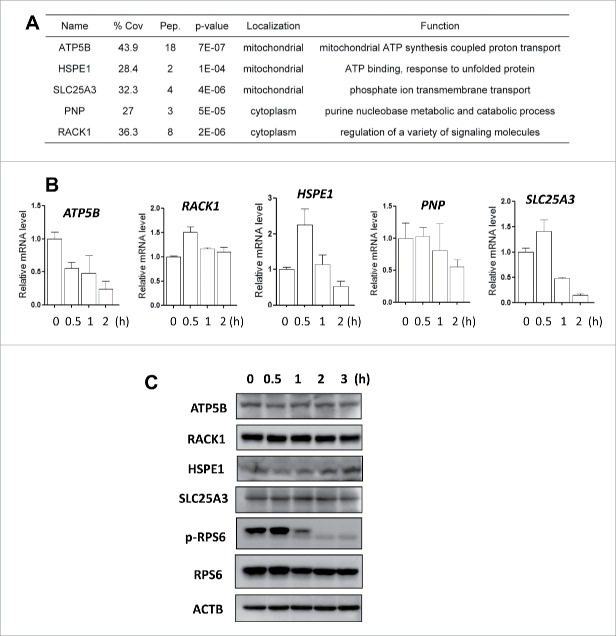
Transcriptional response in starvation-induced autophagy. (A) The representative newly synthesized proteins selected for the subsequent functional studies. % Cov = Coverage rate; Pep. = Numbers of peptides. (B) HeLa cells were cultured in amino acid-free medium for starvation (0.5, 1, or 2 h). Total RNA was isolated from the cells at the designated time and the mRNA levels of ATP5B, RACK1, HSPE1, PNP and SLC25A3 were quantified by real-time PCR. GAPDH was used as an internal control and the fold change in mRNA levels was calculated by normalizing to GAPDH. (C) Dynamic changes of different proteins under starvation conditions. HeLa cells were cultured in amino acid-free medium for starvation (0.5, 1, 2 or 3 h). Cells were harvested and lysed and the protein levels of ATP5B, RACK1, HSPE1 and SLC25A3 were determined using western blotting. ACTB was used as the loading control.

