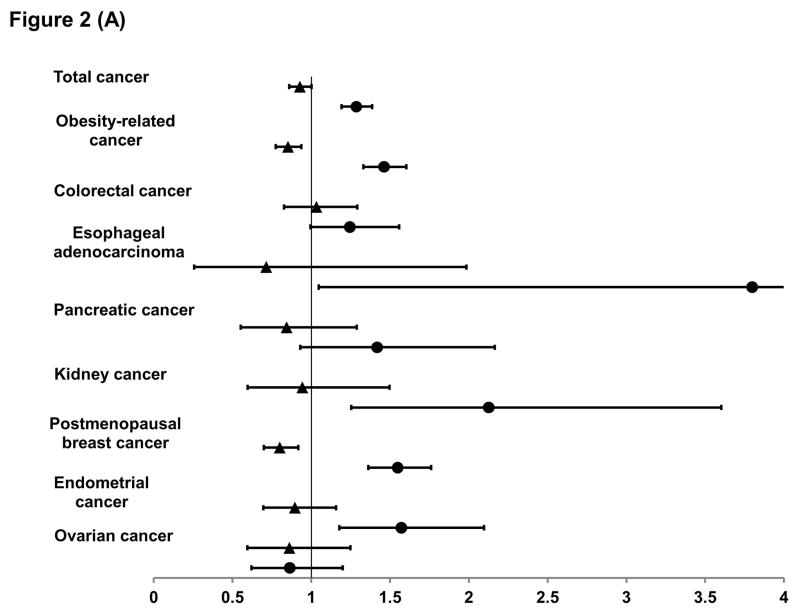
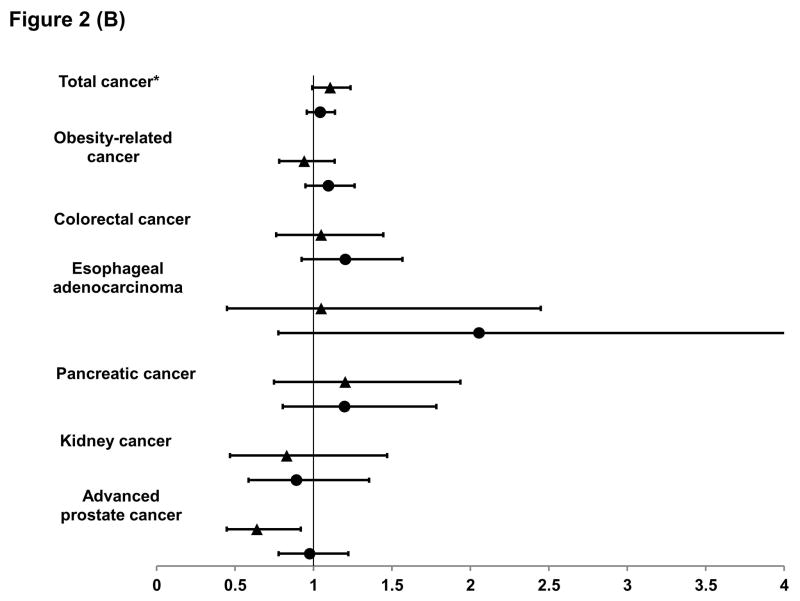
Figure 2. Relative risk and 95% confidence interval of cancer according to early-life (▲) and late-life (●) body shape in women (A) and men (B).
For early life body shape, we compared the risk in the heavy-stable/increase to the lean-marked increase groups in the multivariable model (see footnote of Table 1), with further adjustment for average body shape from age 40 to 60. Similarly, for late life body shape, we compared the risk in the lean-marked increase to the lean-stable groups with further adjustment for average body shape from age 5 to 20.
*For total cancer in men, we excluded non-advanced prostate cancer.


