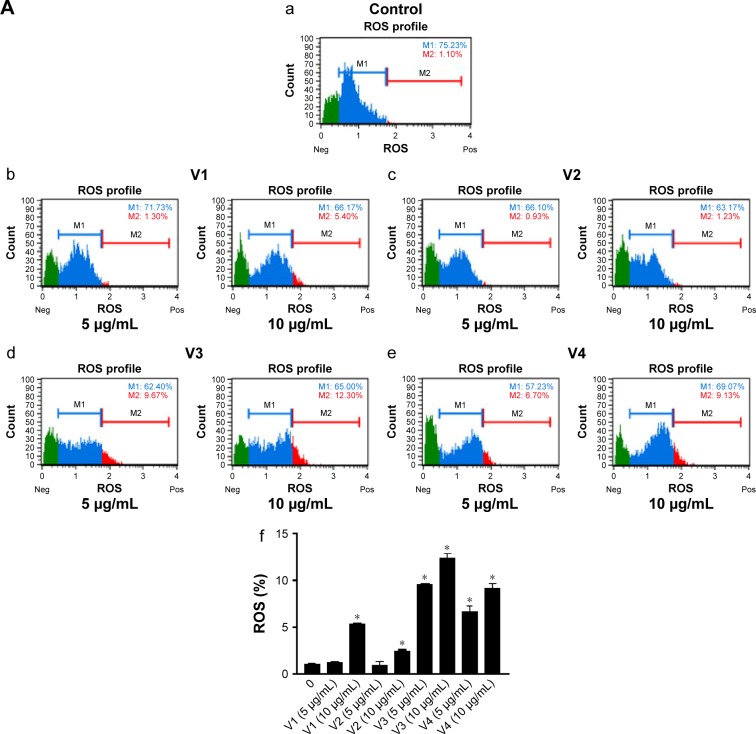
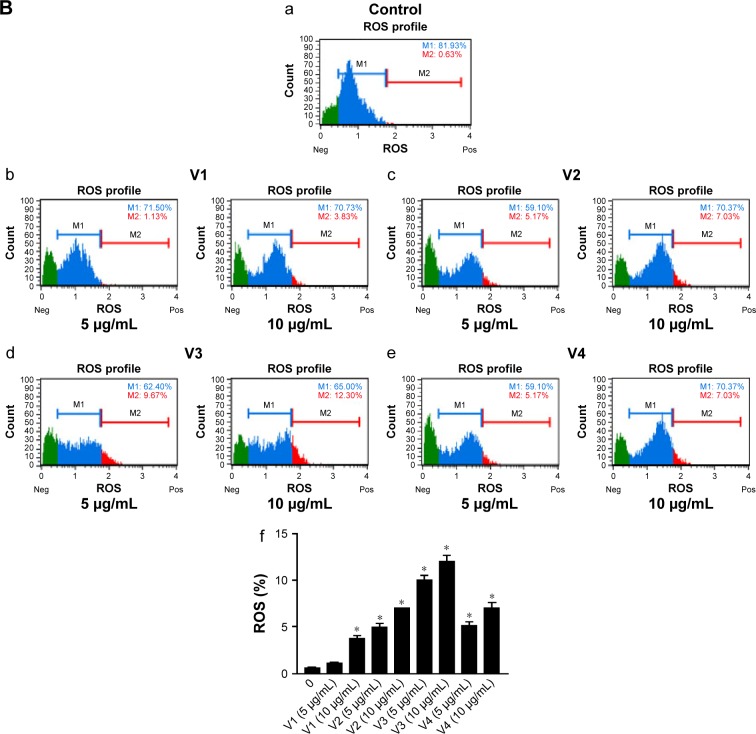
Figure 4.
ROS was evaluated in (A) HCT-8 and (B) MDA-MB-231 cell lines, when treated with snake venoms for 24 hours.
Notes: Quantitative analyses of the ROS (+) were shown in the form of bar graphs (f), a=control, b= v1; 5 µg/ml and 10 µg/ml, c= v2; 5 µg/ml and 10 µg/ml, d= v3; 5 µg/ml and 10 µg/ml, e= v4; 5 µg/ml and 10 µg/ml. *P-values ≤0.05 were considered significant. V1, V2, V3, and V4 are the venoms obtained from the species of the snakes, namely Bitis arietans, Cerastes gasperettii, Echis coloratus, and Echis pyramidum, respectively.
Abbreviations: Neg, negative; Pos, positive; ROS, reactive oxygen species.


