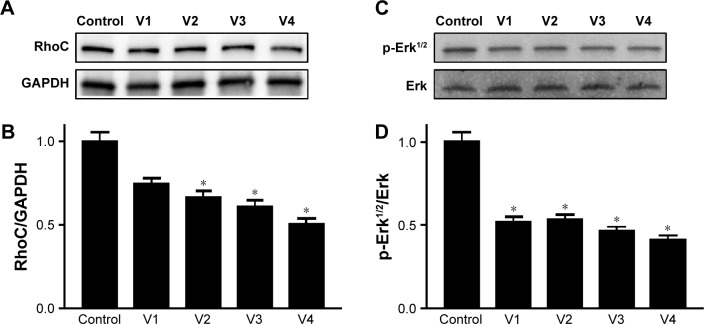
Figure 7.
Western blot analyses performed on W3 Western Workflow.
Notes: Equal amounts of proteins from venom-treated and control cell lines were separated on 10%–12% gradient gels. Membranes were probed with p-Erk1/2, RhoC, and GAPDH primary antibodies (1:1,000) and anti-rabbit IgG–HRP-conjugated secondary antibody (1:2,500). Protein bands were visualized in ChemiDoc MP imaging system after treating the membranes with ECL for 5 minutes at room temperature in dark. Densitometric analyses were performed using Image-J programing. V1, V2, V3, and V4 are the venoms obtained from the species of the snakes, namely Bitis arietans, Cerastes gasperettii, Echis coloratus, and Echis pyramidum, respectively. A= Western blot of RhoC, B= Normalized band density of RhoC by GAPDH, C= Western blot of P-Erk1/2, D= Normalized band density of p-Erk1/2 by total Erk. *Statistically significant.
Abbreviation: ECL, enhanced chemiluminescence.

