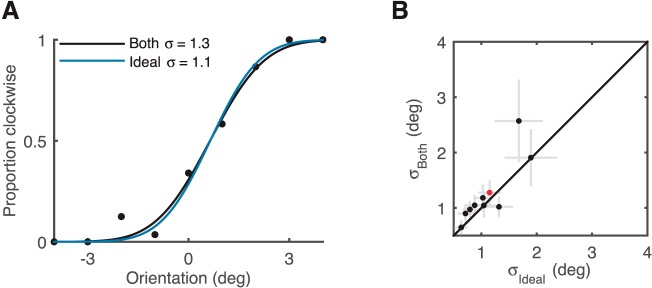
Figure 3.
Humans integrate orientation information suboptimally. (A) Psychometric curve of an example subject in the “both” condition (black dots and black fit curve; same data as Figure 2A) compared to the ideal observer that optimally integrates information from the fovea and periphery (blue curve). (B) SD in the “both” condition plotted as a function of the SD of an ideal integrator. For most subjects the SD in the “both” condition was slightly greater than ideal, meaning worse orientation discrimination. Gray error bars: ±1 SE. Red dot: example subject in Figure 2A.

