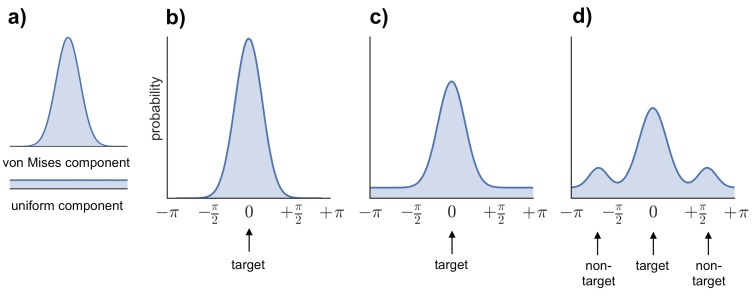
Figure 6. Models fitted to the error distribution.
(a) Components used to model the error data. (b–d) Illustrations of the three models compared to analyze participants’ error distributions, including von Mises alone (b), von Mises + uniform (c), and von Mises + uniform + additional von Mises distributions modeling non-target errors (d).

