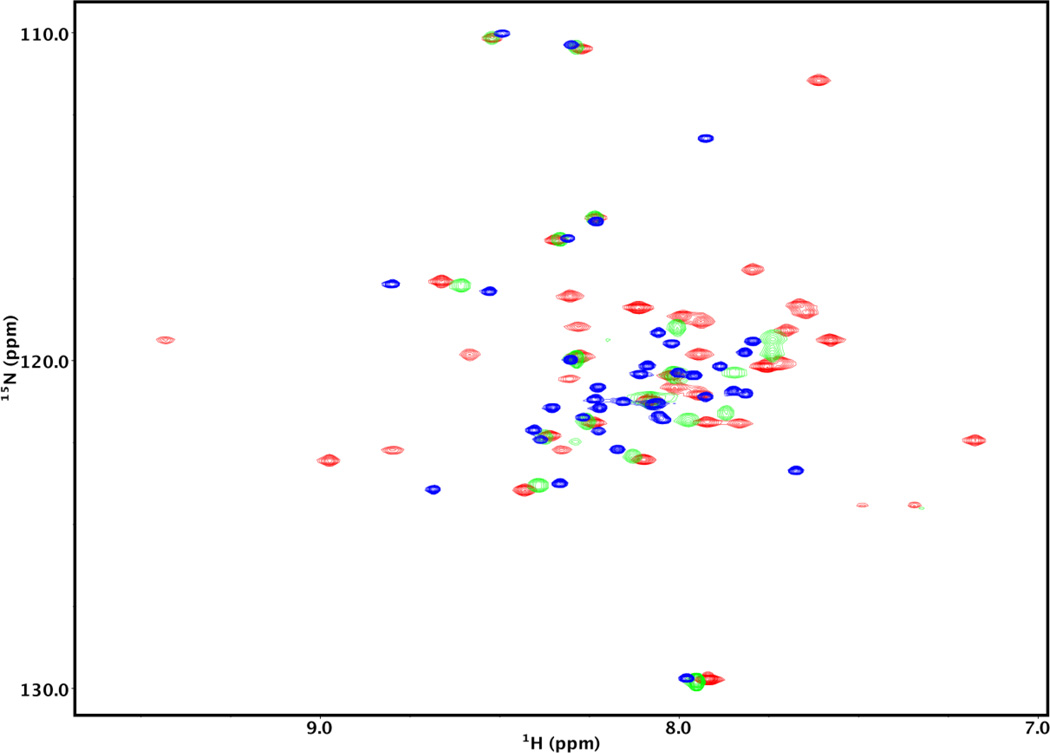
Figure 3.
2D 15N-HSQC spectra of 15N-labeled Lmod2s1 in the presence and absence of αTM1a1-14Zip. The spectra were recorded on a Varian VNMRS 600 MHz spectrometer. The concentration of Lmod2s1 was 0.22 mM. The blue spectrum was recorded in the absence of αTM1a1-14Zip. The green and red spectra were obtained in the presence of 0.12 mM and 0.24 mM αTM1a1-14Zip, respectively.

