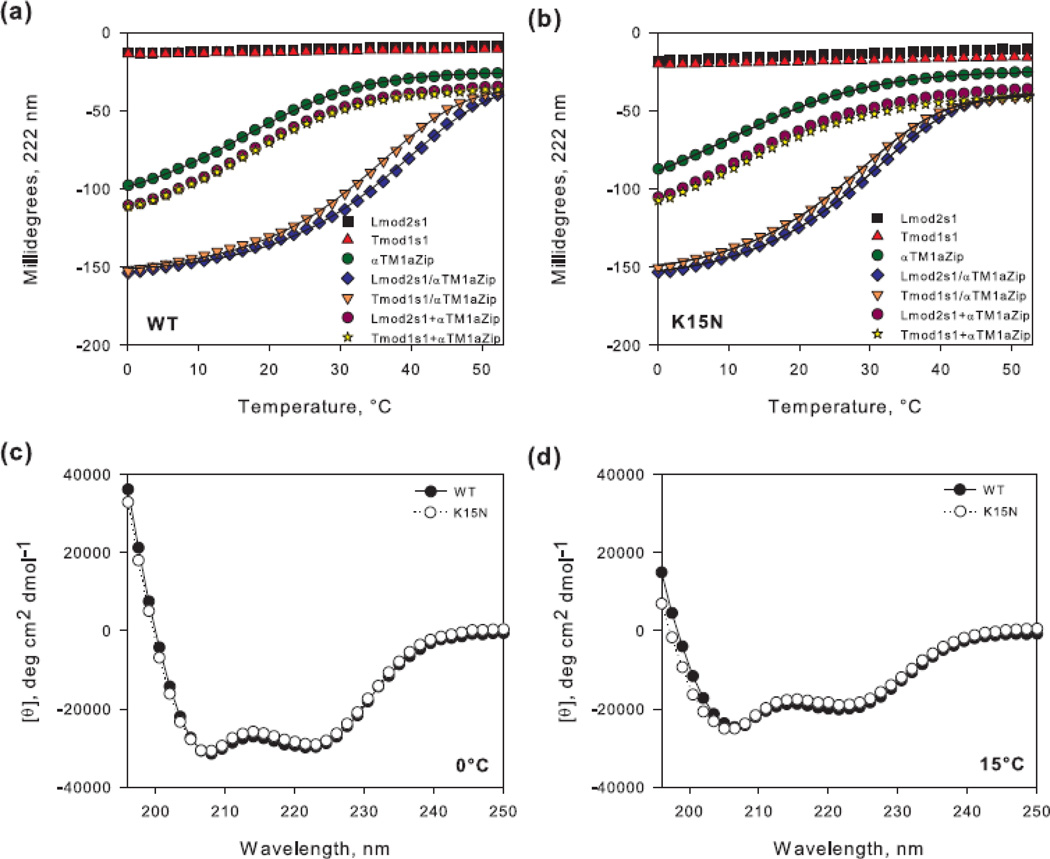
Figure 6.
Representative unfolding curves of peptide complexes and CD spectra of αTM1a1-21Zip. Binding of 40 µM Lmod2s1 or Tmod1s1 to equimolar concentration of αTM1a1-21Zip (a) wild type (WT) and (b) [K15N] was assayed using CD spectroscopy. The graphs illustrate the unfolding curves of the individual peptides (Lmod2s1, Tmod1s1, αTM1a1-21Zip), the mixtures (Lmod2s1/αTM1a1-21Zip, Tmod1s1/αTM1a1-21Zip) and the sums of the individual unfolding curves (Lmod2s1+αTM1a1-21Zip, Tmod1s1+αTM1a1-21Zip). The lines show fitted curves to the experimental data. Spectra of αTM1a1-21Zip and αTM1a1-21Zip[K15N] at (c) 0°C and (d) 15°C.

