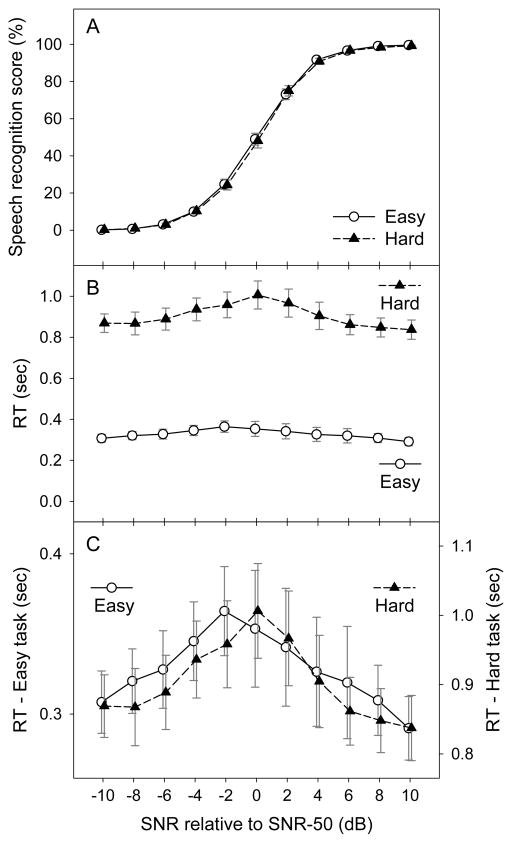
Figure 4.
Speech recognition score (4A) and reaction time (RT) of the secondary task (4B and 4C) averaged across participants as a function of signal-to-noise ratio (SNR) of Experiment 3. In Figure 4C the y-axes of the RT curves are rescaled so that the curves of the easy task (refer to the left y-axis) and the hard task (refer to the right y-axis) have similar peak heights in the figure. Error bars = 1 SE.

