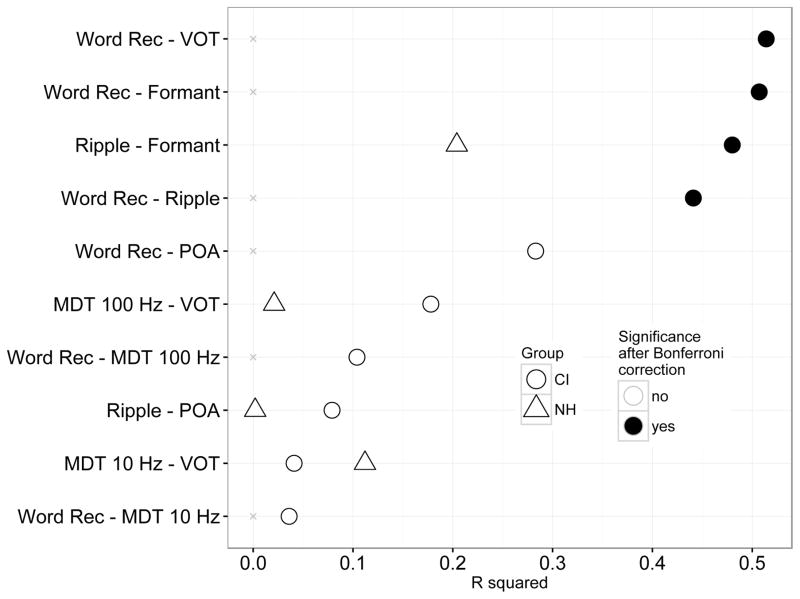
Figure 10.
R-squared correlation values for each of the comparisons across different sub-tests in this study, ordered by strength of correlation (r-squared value). Specific predictions included the correspondence between “spectral” tests (spectral ripple discrimination, formant categorization, POA adjustment), and between “temporal” tests (temporal modulation detection at 100 Hz and 10 Hz, and VOT categorization. For each comparison, the p-value was adjusted using the Bonferroni correction for ten planned comparisons; statistical significance after this correction is indicated by solid black fill in the data points. Listeners with NH did not complete word/phoneme recognition, and therefore have no correlations to report for any comparisons involving those two metrics.

