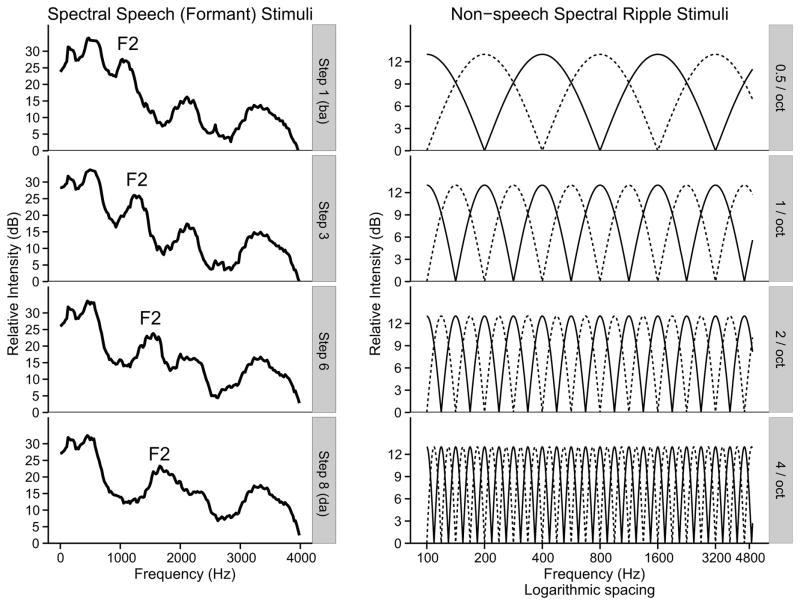
Figure 2.
Frequency-amplitude spectra for selected steps in the formant continuum (left panels) and selected spectral ripple densities (right panels). Speech spectra are obtained from the first 80 ms of each stimulus following consonant release. Dashed lines in the spectral ripple panels represent the 90-degree phase shift for each stimulus.

