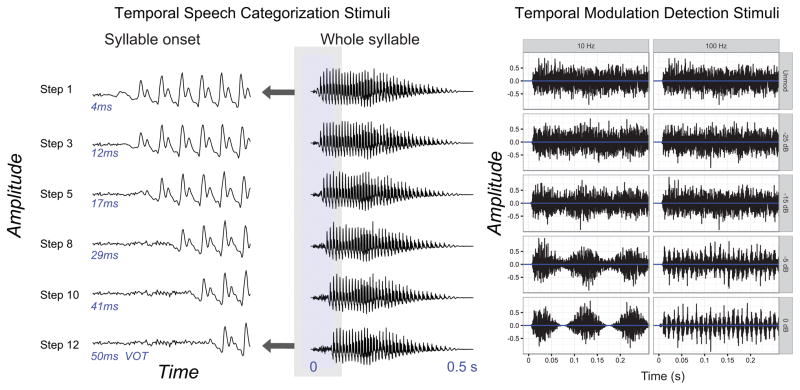
Figure 3.
Time waveforms of selected steps in the VOT continuum (left and center images) and selected modulation depths for the 10 Hz and 100 Hz modulated noise stimuli (right images). The left third of the figure illustrates a zoomed-in portion of the onset (i.e. VOT aspiration segment) of the entire syllable, which is shown in the middle portion. The right portion of the plot illustrates examples of temporal modulation detection stimuli that vary by modulation depth (rows) at two different modulation rates (columns).

