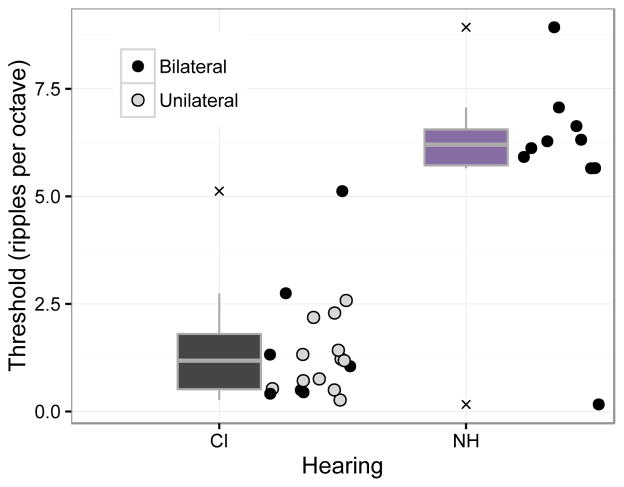
Figure 6.
Boxplots and individual data points for all listeners in the spectral ripple discrimination test. The lower and upper edges of the boxplots correspond to the first and third quartiles (the 25th and 75th percentiles), with whiskers extending from the hinge to the highest/lowest value that is within +/−1.5 * IQR of the hinge, where IQR is the inter-quartile range, or distance between the first and third quartiles. Data beyond the end of the whiskers are outliers and plotted as Xs. Within the individual points for CI users, black-filled points show data for bilateral users (tested with both processors on) and gray-filled points show data for unilateral users.

