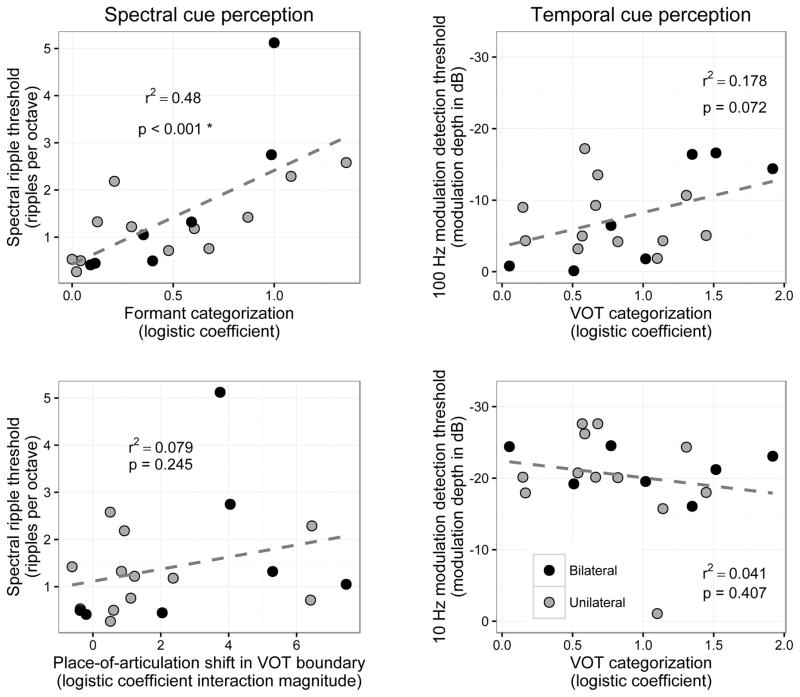
Figure 8.
Scatterplot of psychoacoustic discrimination results (y axes) as a function of speech cue categorization results (x axes), for CI listeners only. Left panels correspond to “spectral” tests and right panels correspond to “temporal” tests. The left panels show spectral ripple discrimination threshold as a function of formant cue GLM coefficient (top left panel) and place-of-articulation (POA) GLM coefficient (bottom left panel) for individual listeners. POA is a spectral cue whose impact is measured as the change in categorization function of VOT. The right panels show modulation depth threshold for 100 Hz (upper right panel) and 10 Hz (lower right panel) modulated noises as a function of VOT GLM coefficient. Dashed lines indicate linear fit to the data in each plot, collapsing both unilateral and bilateral users into a single group. The asterisk reflects significance after Bonferroni correction for ten planned comparisons (including the four on this figure and six on the next figure).

