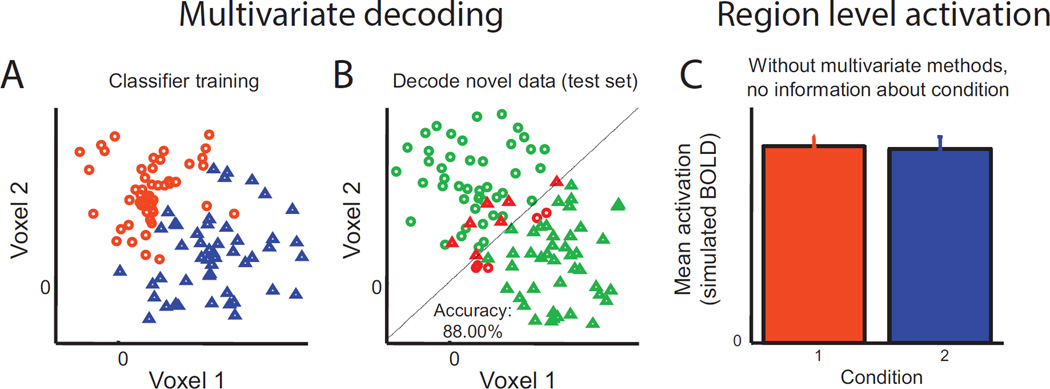
Figure 2.
A hypothetical dataset in which activation across a “region” of 2 voxels carries information which can discriminate between 2 conditions, but in which the mean activation level is equivalent across the two voxels. (A) Scatter plot of activation in each voxel for each trial, color-coded based on their condition. In order to identify which of two conditions (condition 1, orange circles, condition 2, blue triangles) the activation from a given trial corresponds to, a linear classifier can be trained to find a line which best discriminates conditions 1 and 2. Note that a line is used because this is a 2-dimensional space; a hyperplane would be used in a more realistic situation where the pattern extended across many voxels. (B) An independent test set is then used to evaluate how well this decision rule discriminates between the two conditions. Trials in the test set known to be from condition 1 (circles) and condition 2 (triangles) are color-coded based on whether they are accurately classified (green is correct, red is incorrect). (C) Without this type of multivariate analysis, this 2-voxel activation pattern would be assumed to carry no information about which condition a trial belongs to. Adapted from Sprague and Serences (2015). Reprinted with permission from the authors and the original publisher.

