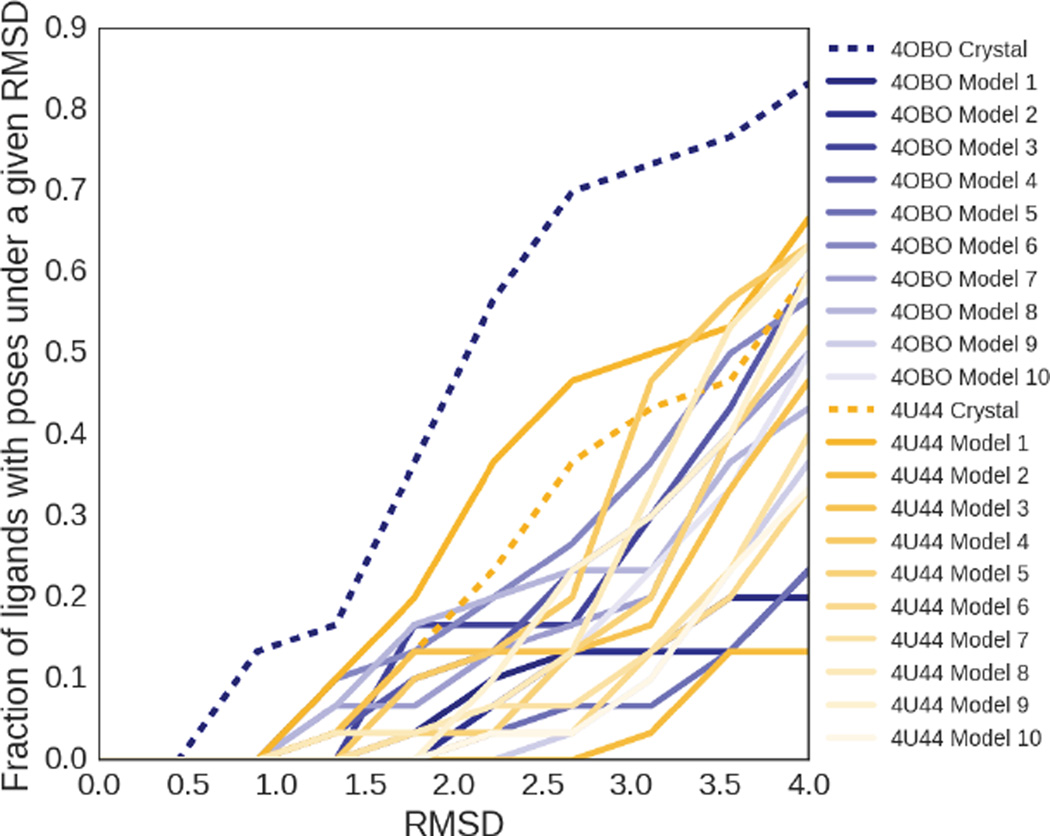
Fig. 4.
Fraction of ligands with poses under a given RMSD, colored by the receptor structure associated with the subset of poses used for the calculation. The starting PDB crystal structures are shown with dashed lines in the darkest colors, while the structures generated from molecular dynamics simulations are colored according to a gradient based on their frame number, representing their distance from the initial crystal structure used to start the simulation.

