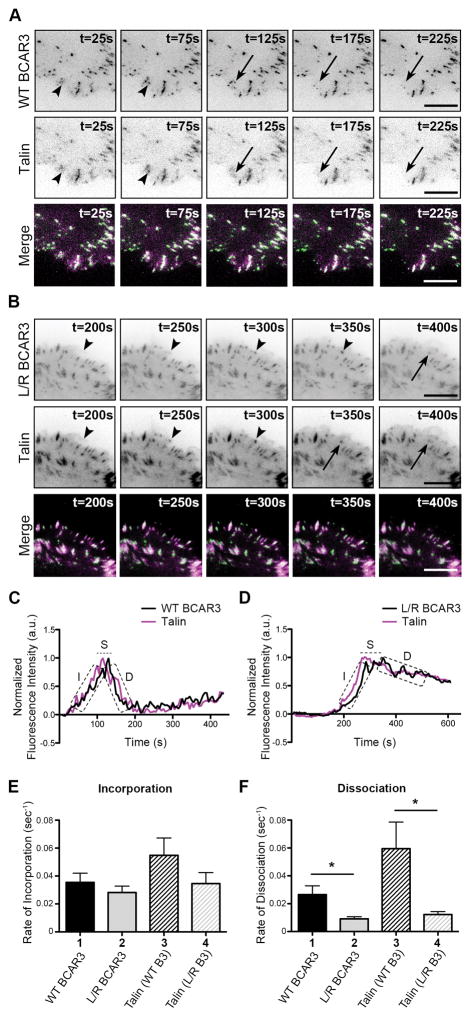
Figure 4. Direct interaction between BCAR3 and Cas is required for efficient dissociation of talin from adhesions.
BT549 invasive breast cancer cells were co-transfected with plasmids encoding WT or L744E/R748E (L/R) GFP-BCAR3 and mCherry-talin, incubated for 24 hours, and then plated on 2μg/ml fibronectin-coated glass-bottomed TIRF dishes for 30–40 minutes prior to visualizing adhesion dynamics via live-imaging TIRF. (A, B) Representative time-lapse images show incorporation into adhesions (arrowheads) and dissociation (arrows) of the indicated proteins over the specified time course. Scale bars = 100μm. (C, D) Representative fluorescence intensity time tracings of BCAR3 (black) and talin (magenta) present in adhesions from cells expressing WT (C) or L744E/R748E (L/R) GFP-BCAR3 (D). Dashed boxes/line indicate the incorporation (I), stability (S), and dissociation (D) phases of adhesion dynamics. (E, F) Quantitative analysis of the incorporation (E) and dissociation (F) rates of WT GFP-BCAR3 (bar 1), L744E/R748E (L/R) GFP-BCAR3 (bar 2), Talin co-expressed with WT GFP-BCAR3 (bar 3), and Talin co-expressed with L744E/R748E (L/R) GFP-BCAR3 (bar 4). Data presented are the mean ± SEM of ≥14 adhesions from 5 separate WT BCAR3/talin or 3 separate L744E/R748E BCAR3/talin movies generated from 3 independent experiments. *, p<0.05

