Figure 2.
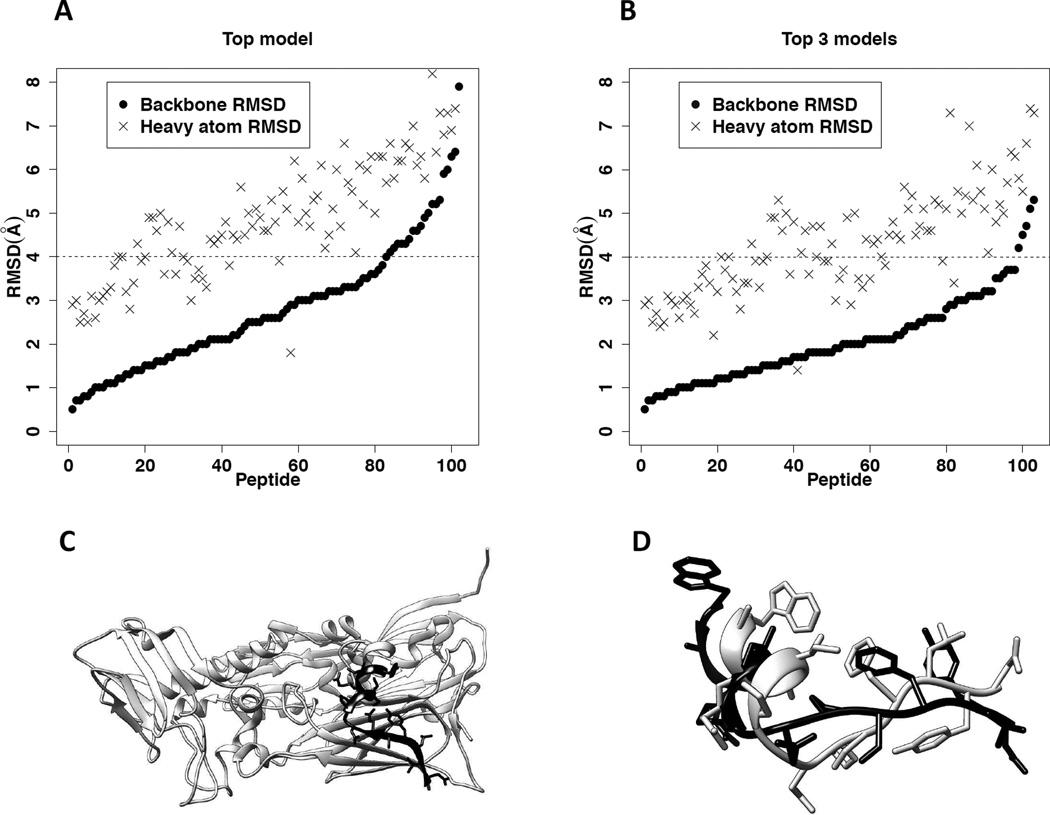
Modeling peptide conformers based on the template fragments of monomeric proteins for 103 bound peptides in peptiDB. Also see Table S2. A. The distributions of bRMSD and hRMSD between the top modeled conformer and the corresponding bound peptide structure for the 103 peptides. The horizontal axis shows individual peptide (ranging from 1 to 103). The black dashed line represents 4.0Å in bRMSD, the defined threshold for a successful prediction of the peptide conformation. B. The distributions of bRMSD and hRMSD between the best modeled conformer (i.e., the conformer with the lowest bRMSD) in the top 3 models and the corresponding bound peptide structure for the 103 peptides. C. The top template (amino acids 450 – 463 in PDB entry 3SAM, chain A) for the bound peptide in the protein-peptide complex 2BBA. The protein 3SAM is shown in ribbon diagram and colored light gray. The template fragment is highlighted in black, with their side chains displayed in stick mode. D. The superimposed top modeled peptide conformer and its corresponding bound peptide structure in pdb entry 2BBA. The modeled peptide structure is colored black, and the bound peptide structure is colored light gray.

