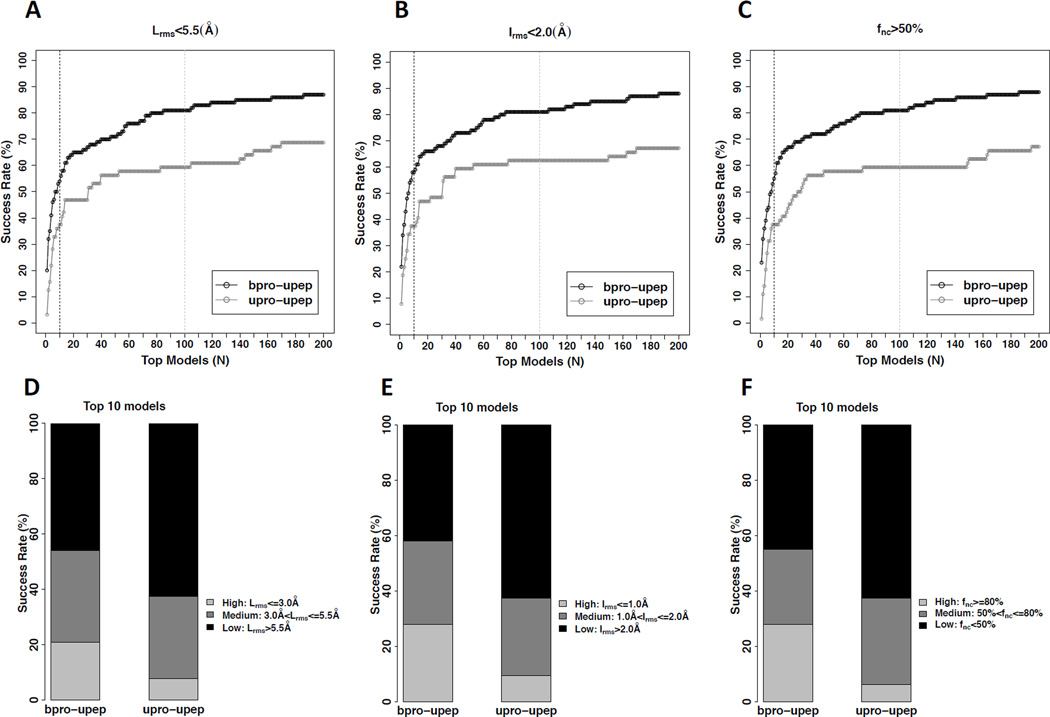
Figure 5.
The performance of of ranking the sampled peptide binding modes for both the bound docking cases and the unbound docking cases in peptiDB. Also see Tables S3–S5 and Figure S5. A. The success rates of ranking at least one near-native (i.e., medium-quality or high-quality) mode based on Lrms among the top N models for the bound docking cases (bpro-upep) and the unbound docking cases (upro-upep), respectively. The black dashed line and the light gray dashed line correspond to N = 10 and N = 100, respectively. B. The success rates based on Irms among the top N models for the bound docking cases (bpro-upep) and unbound docking cases (upro-upep), respectively. C. The success rates of ranking at least one near-native mode based on fnc among the top N models for the bound docking cases (bpro-upep) and unbound docking cases (upro-upep), respectively. D. The scoring performance using the top 10 modes based on the criterion of Lrms for the bound docking cases (bpro-upep) and unbound docking cases (uproupep), respectively. E. The scoring performance using the top 10 modes based on the criterion of Irms for the bound docking cases (bpro-upep) and unbound docking cases (upro-upep), respectively. F. The scoring performance using the top 10 modes based on the criterion of fnc for the bound docking cases (bpro-upep) and unbound docking cases (upro-upep), respectively.

