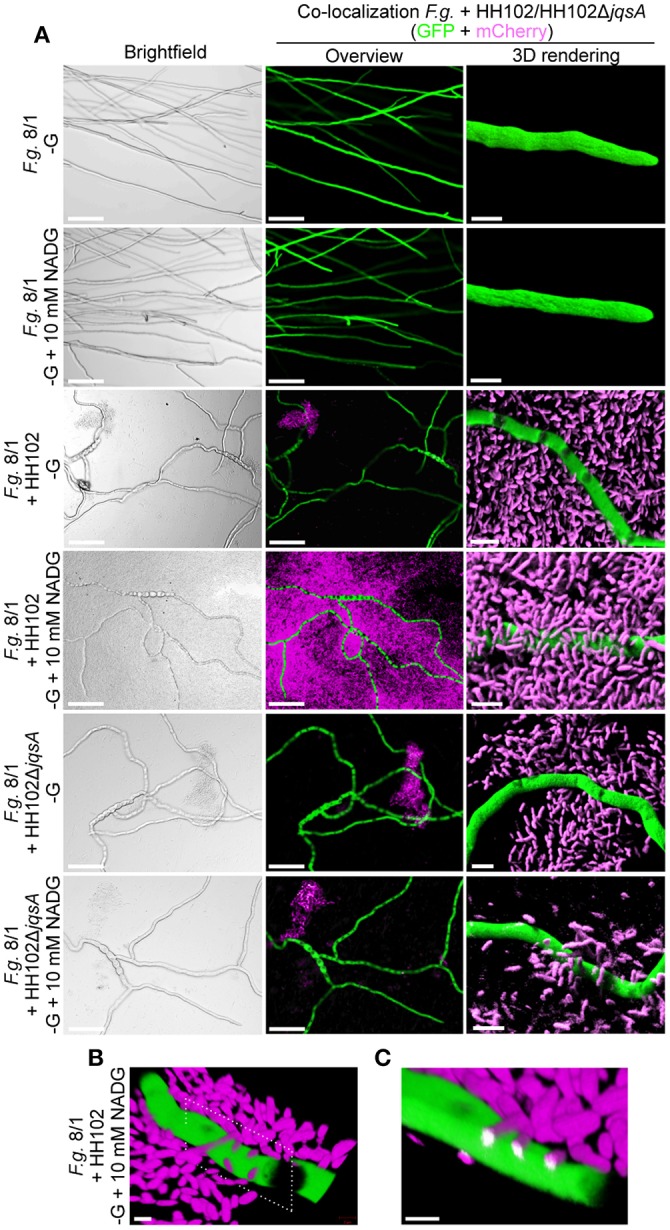
Figure 5.

Microscopic images reflecting the interaction between HH102 or HH102ΔjqsA and F. graminearum. (A) Co-localization of mCherry-tagged HH102 and HH102ΔjqsA cells and GFP-tagged F. graminearum in co-cultures. Left panels, bright field overview images; middle panels, same section image as on left side panel but using fluorescence detection for GFP and mCherry; and right panels, 3D rendering of selected regions. Scale bars: overview (left and middle panels) micrographs = 100 μm; 3D-rendered micrographs = 5 μm (right panels). No mCherry-based fluorescence was visible in control cultures without bacteria. (B) 3D-projection of HH102 cells attached to hyphae of F. graminearum in cultures supplemented with NADG. Dotted frame indicates plane of in silico cross section in (C). Scale bar = 2 μm. (C) In silico cross section at sites of bacterial attachment on F. graminearum hyphae. Bacterial interaction and penetration into fungal hypha is indicated by white color. Scale bar = 2 μm. The HH102 and HH102ΔjqsA cells constitutively expressing mCherry were co-incubated with F. graminearum expressing GFP in 200 μl R2A −G supplemented with or without 10 mM N-acetyl-D-glucosamine (NADG) at 28°C for 72 h. Micrographs were taken by confocal laser-scanning microcopy. Green color shows GFP-, magenta color shows mCherry-emitted fluorescence.
