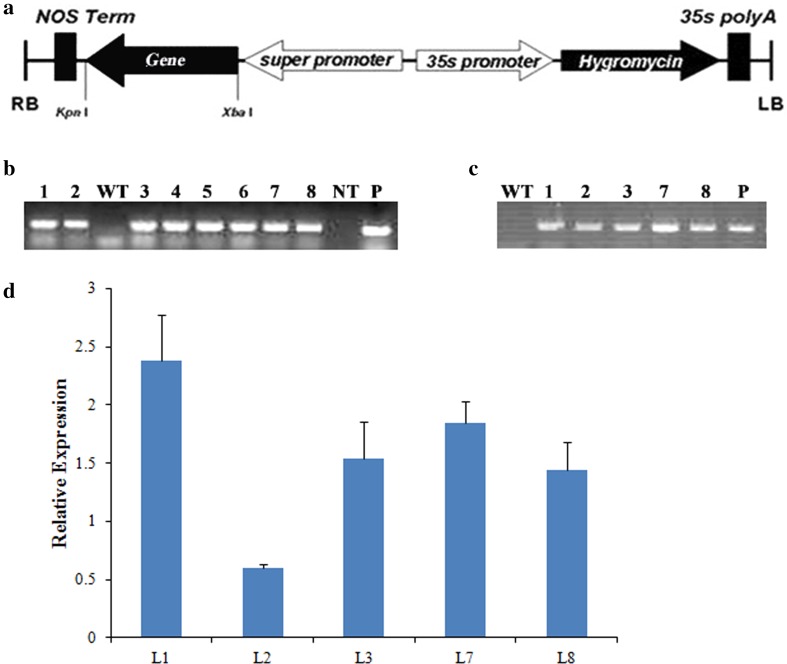
Fig. 5.
Plant transformation vector and the expression patterns of the TIFY genes in the transgenic lines. a Schematic representation of the T-DNA region of the pSuper1300-GaJAZ5 binary vector. b PCR analysis of the selected marker gene. WT wild-type, NT non-template, P plasmid, L1, L2, L3, L7, L8 transgenic lines expressing GaJAZ5. c Genomic PCR analysis of the GaJAZ5 gene. d GaJAZ5 expression patterns in transgenic plants. Values are presented as the means of three replicates. Error bars indicate the standard deviations. The histone gene was used as an internal control to normalize gene expression levels

