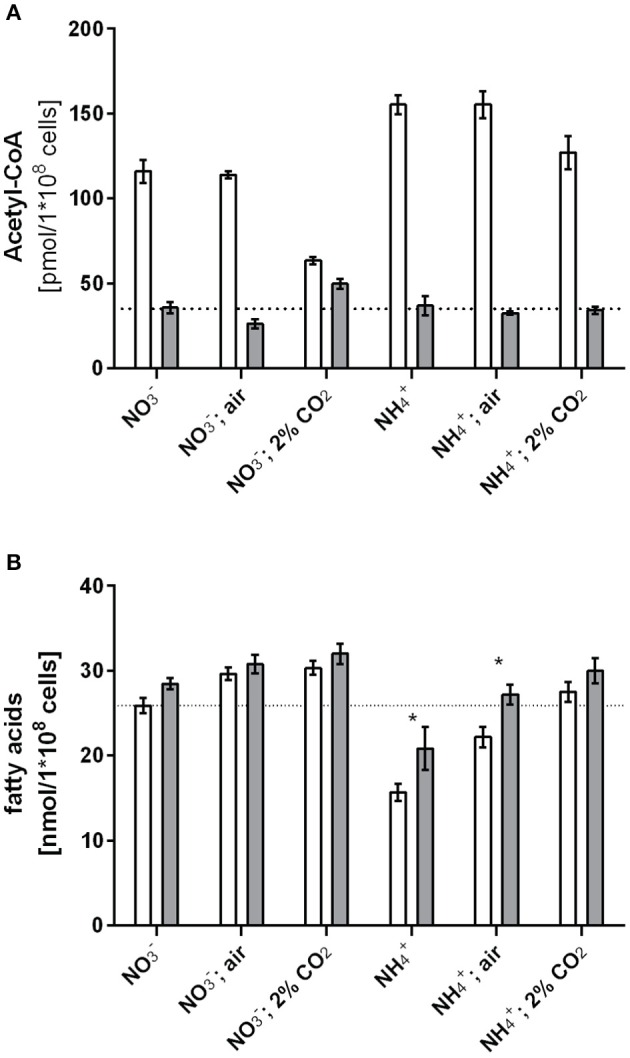
Figure 3.

Acetyl-CoA levels (A) and fatty acid levels (B) under different carbon nitrogen regimes during exponential growth in the wild type and the PII mutant. Values represent the mean of three biological replicates. Differences in acetyl-CoA levels using the tested growth conditions are statistically significant (p < 0.05; unpaired t-test). Statistically significant values of fatty acid levels are marked with a star (p < 0.05; unpaired t-test).
